Momentum Equilibrium Channel Trend Tracking Strategy

Overview
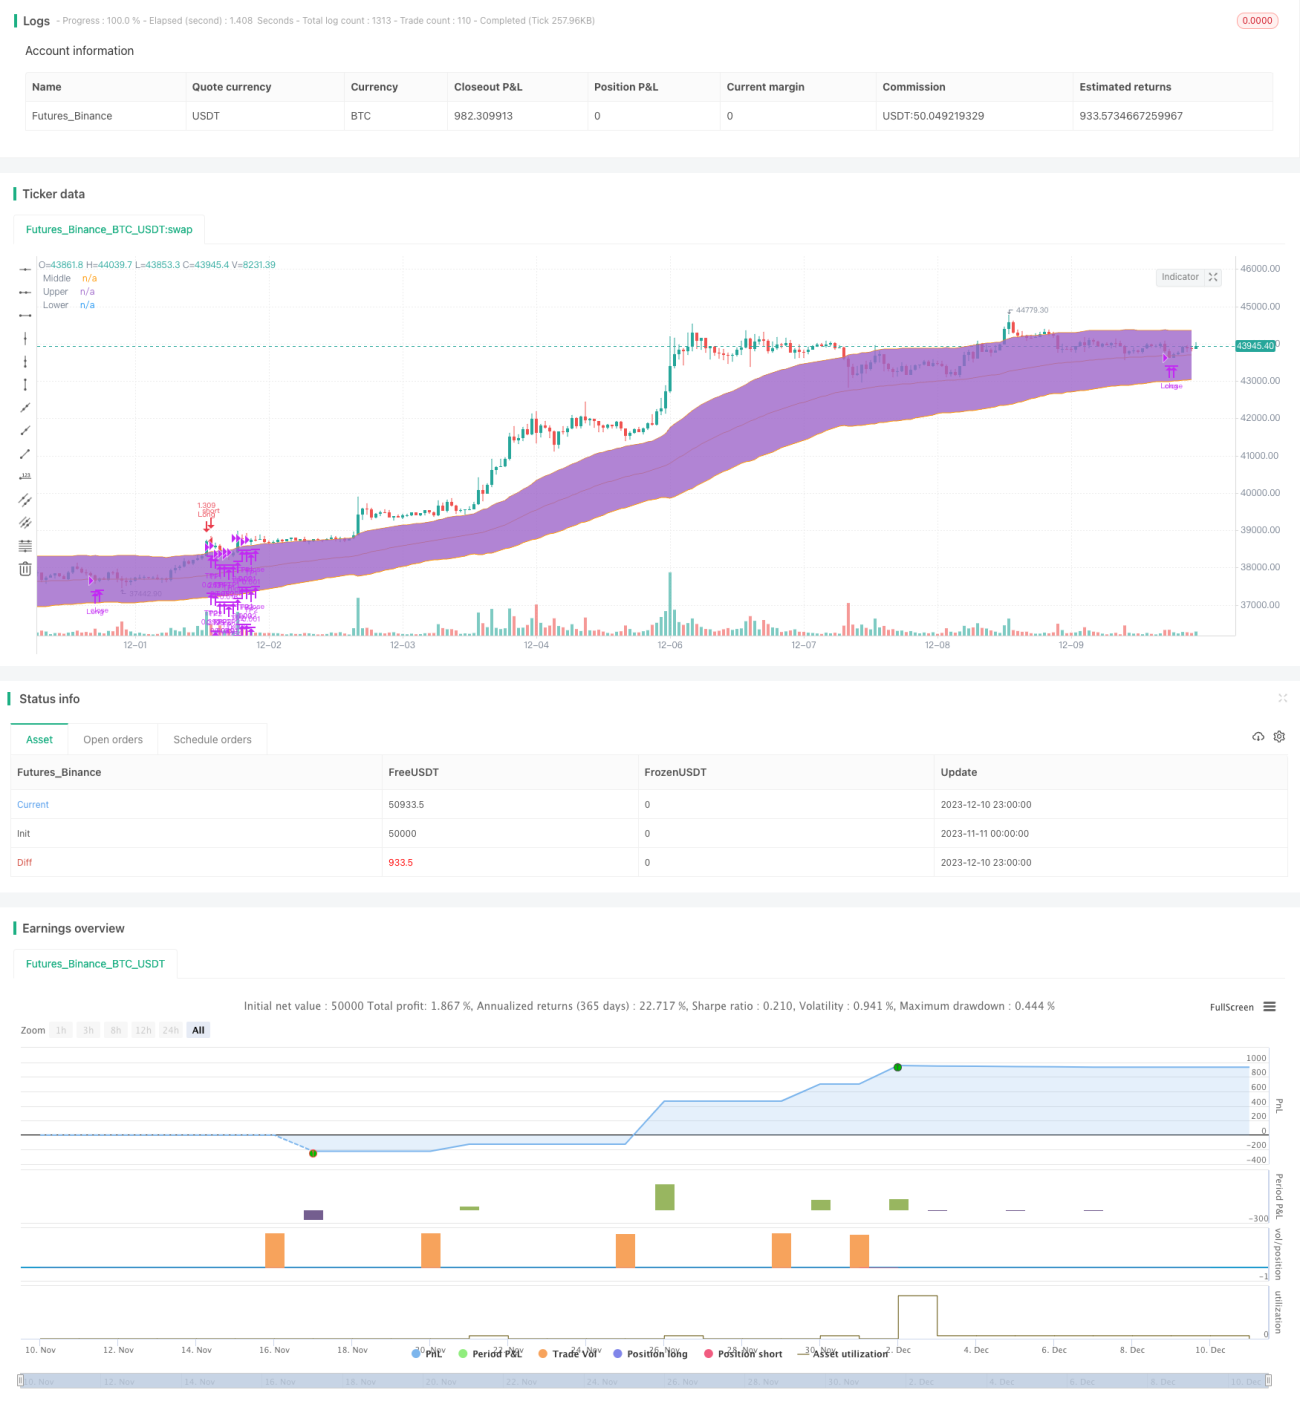
This strategy identifies trend formations by calculating channels and momentum indicators to achieve trend tracking trading. Specifically, it combines momentum indicators and equilibrium channel indicators, and takes advantage of both to intervene in long-term trends while using equilibrium channels to lock in long profit areas.
Strategy Principle
The strategy mainly uses the following two indicators for judgment:
-
Momentum Indicator (DMI): Judge the long and short trend in the market and generate trading signals when the index is greater than the set threshold.
-
Equilibrium Channel (Keltner Channel): Determine the trend area. When the price breaks through the upper rail, it is time to buy, and when the price falls below the middle rail, it is a signal to close the position.
The specific trading logic is: When the +DI momentum indicator is greater than the set threshold (default 32), it is determined that a bullish trend has formed. At this time, if the price breaks through the upper rail of the equilibrium channel, a buy signal is generated; after that, the equilibrium channel is used. The middle rail is used as a stop loss line to track the stop loss and achieve profit protection.
This strategy combines the advantages of two indicators, uses momentum indicators to determine trend direction, and uses equilibrium channels to determine entry timing and stop loss areas. The double indicator combination allows the strategy to efficiently enter early in the discovery of a trend, while using channel indicators to lock in profits and stops.
Advantage Analysis
-
The strategy uses momentum indicators to determine the early stage of market trends, which is more efficient than lagging indicators such as simple moving averages.
-
Using the equilibrium channel to determine the specific trading range can effectively lock the profit zone.
-
The indicator parameters and trading rules are rigorous and reasonable, and the backtest data performs well and verifies the actual combat effect.
-
The strategy is relatively simple and clear, easy to understand and implement, and suitable for quantitative trading beginners to learn.
-
The risk of the strategy is controllable, and it adopts dynamic stop loss with the median line to effectively control single loss.
Risk analysis
-
The strategy is only suitable for trending markets and not suitable for consolidating and fluctuating markets. If the QtCore channel increases and the middle rail stop loss is too loose, it cannot control the loss.
-
The DMI indicator has a certain lag and cannot determine trend confirmation. It may cause losses by intervening in the trend earlier.
-
The fixed percentage stop loss method has risks. It is unable to re-intervene in trends after a sharp fluctuation, thus missing subsequent trends.
-
There are sufficient backtest data, but long-term running is still required to verify parameter stability in real trading.
Optimization
-
Different stop loss methods can be tested, such as ATR stop loss, moving stop loss and so on to replace fixed percentage stop loss.
-
Secondary confirmation indicators can be added, such as volume amplification, to ensure entry after trend confirmation.
-
Different parameter combinations can be tested to find the optimal parameter combination.
-
The robustness of parameters can be verified through stepwise optimization and walk forward testing.
Summary
This strategy achieves efficient capturing of trending markets by using double indicator judgments. The strategy is relatively simple and intuitive with clear logic and good backtest performance. It can serve as one of the entry strategies for quantitative trading. But sufficient verification of real trading data and parameter optimization is still required to reduce real trading losses. This will be the focus of future work.
- 1