RafaelZioni Momentum Trend Following Strategy

Overview
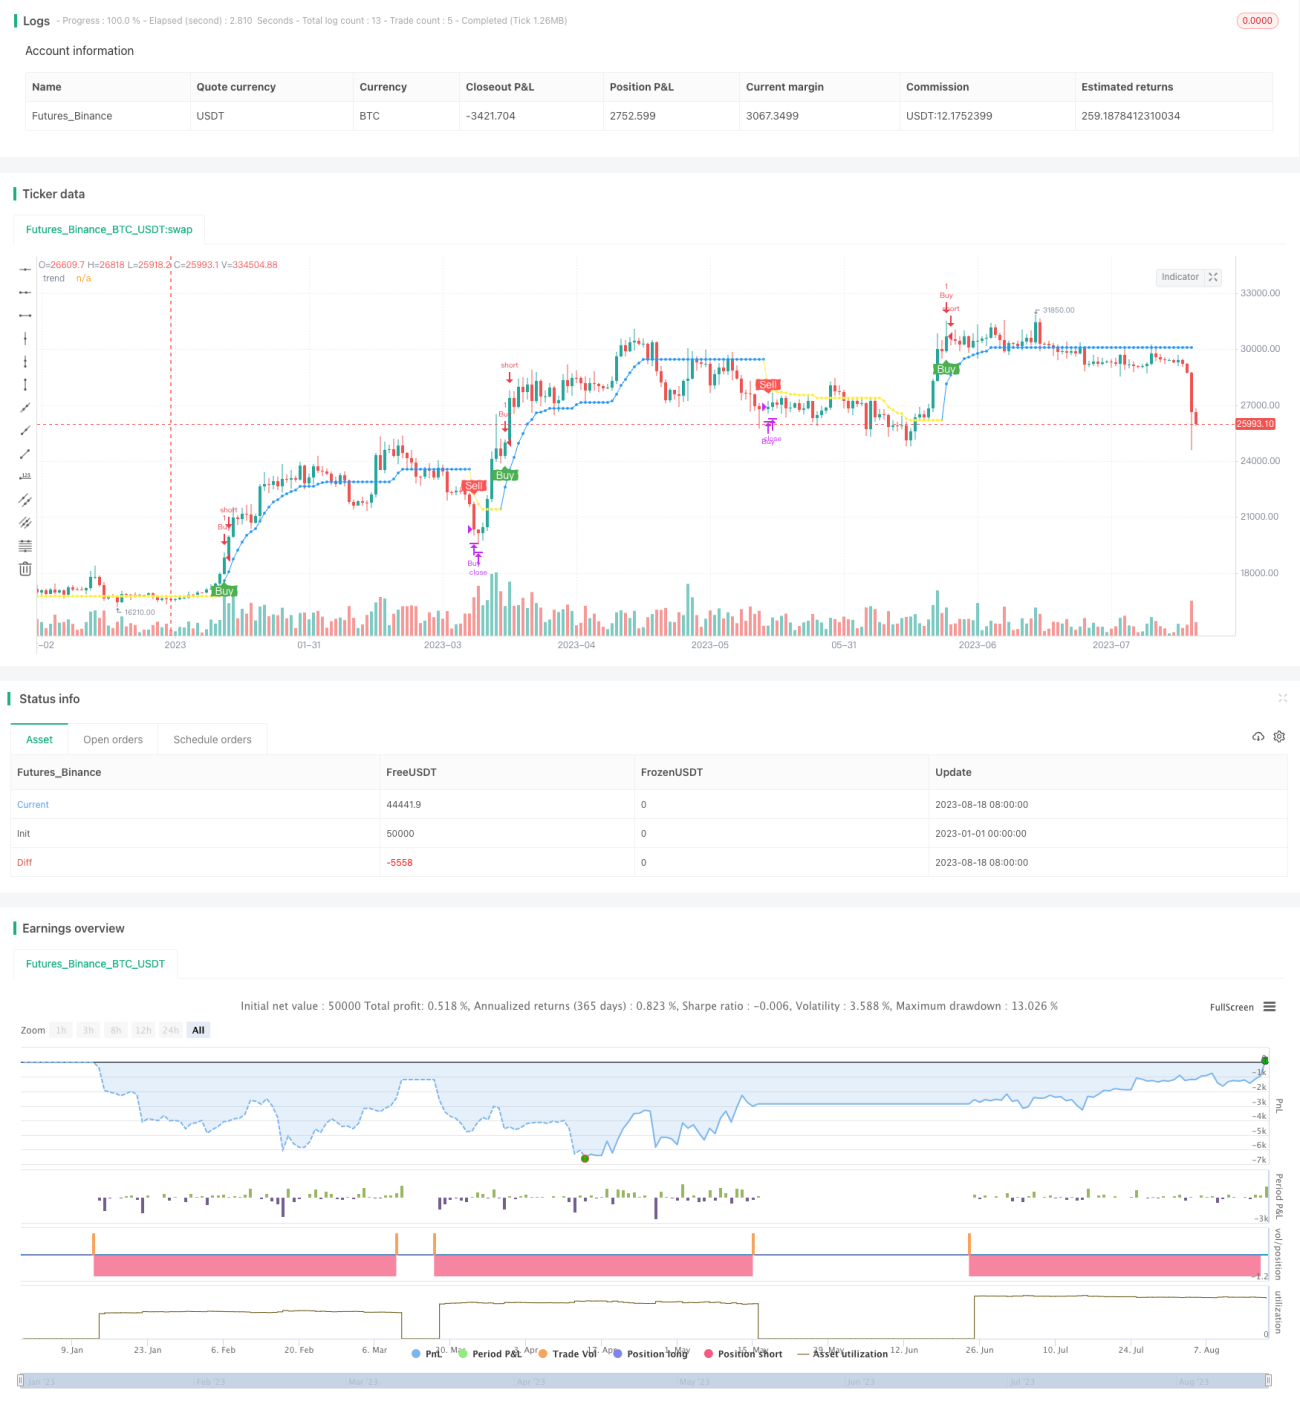
This strategy is based on the SuperB indicator created by RafaelZioni. It identifies trends through momentum indicators and automatically tracks upward and downward trends, belonging to the trend following strategy.
Strategy Logic
The strategy uses the SuperB indicator created by RafaelZioni to identify price trends. The SuperB indicator is based on price fluctuation range, trading volume and the price difference between the open and close prices to calculate the SpreadVol indicator. The SpreadVol indicator reflects the momentum characteristics of prices. This strategy uses the moving average and standard deviation of the SpreadVol indicator to determine thresholds. When SpreadVol is above the upper rail, it is an upward trend. When below the lower rail, it is a downward trend.
The strategy judges trend reversals in real time by tracking high and low prices. In an upward trend, new highs continue to be made, indicating a sustained rise. When the price breaks below the maximum price by a certain percentage, it turns to a downward trend. The judgment method is similar in a downward trend. This allows timely judgments of trend reversal points.
Advantages
The strategy combines momentum indicators to determine the trend direction, and then tracks the highest and lowest prices in real time, which can quickly identify new trend directions and automatically track upward and downward trends, avoiding the risks of missing buying points and overbuying points.
RafaelZioni's SuperB indicator reflects the strength and speed of price changes and can accurately determine true trends, effectively filtering false breakouts. The judgment rules are simple and clear, easy to understand and verify.
It only does long positions to reduce trading costs and slippage losses caused by frequent operations.
Risks
The strategy is prone to multiple false trades in the consolidation area before the breakout. Parameters can be optimized to reduce sensitivity to consolidation areas.
The stop loss line is prone to be triggered during trend shocks. The stop loss range can be appropriately relaxed for longer holding periods.
When switching between long and short, positions need to be switched in a timely manner. If the switch is not timely enough, it may lead to greater losses.
Optimization Suggestions
Optimize the parameters of the SuperB indicator to find better parameter combinations and improve the stability of the indicator.
Optimize the tracking ratio factor of highest and lowest prices to reduce sensitivity to consolidation areas.
Increase the holding time criteria to avoid being stopped out during trend shocks.
Summary
This strategy utilizes the SuperB indicator developed by RafaelZioni to determine the price trend direction, and judges trend reversals by tracking high and low prices in real time, realizing automatic tracking of upward and downward trends, avoiding missing buying points and overbuying risks. It belongs to a momentum strategy with trend following characteristics. This strategy combines momentum indicators to determine true trends with simple and clear rules. It can be further improved and optimized according to the optimization suggestions and is worth researching and applying.
- 1