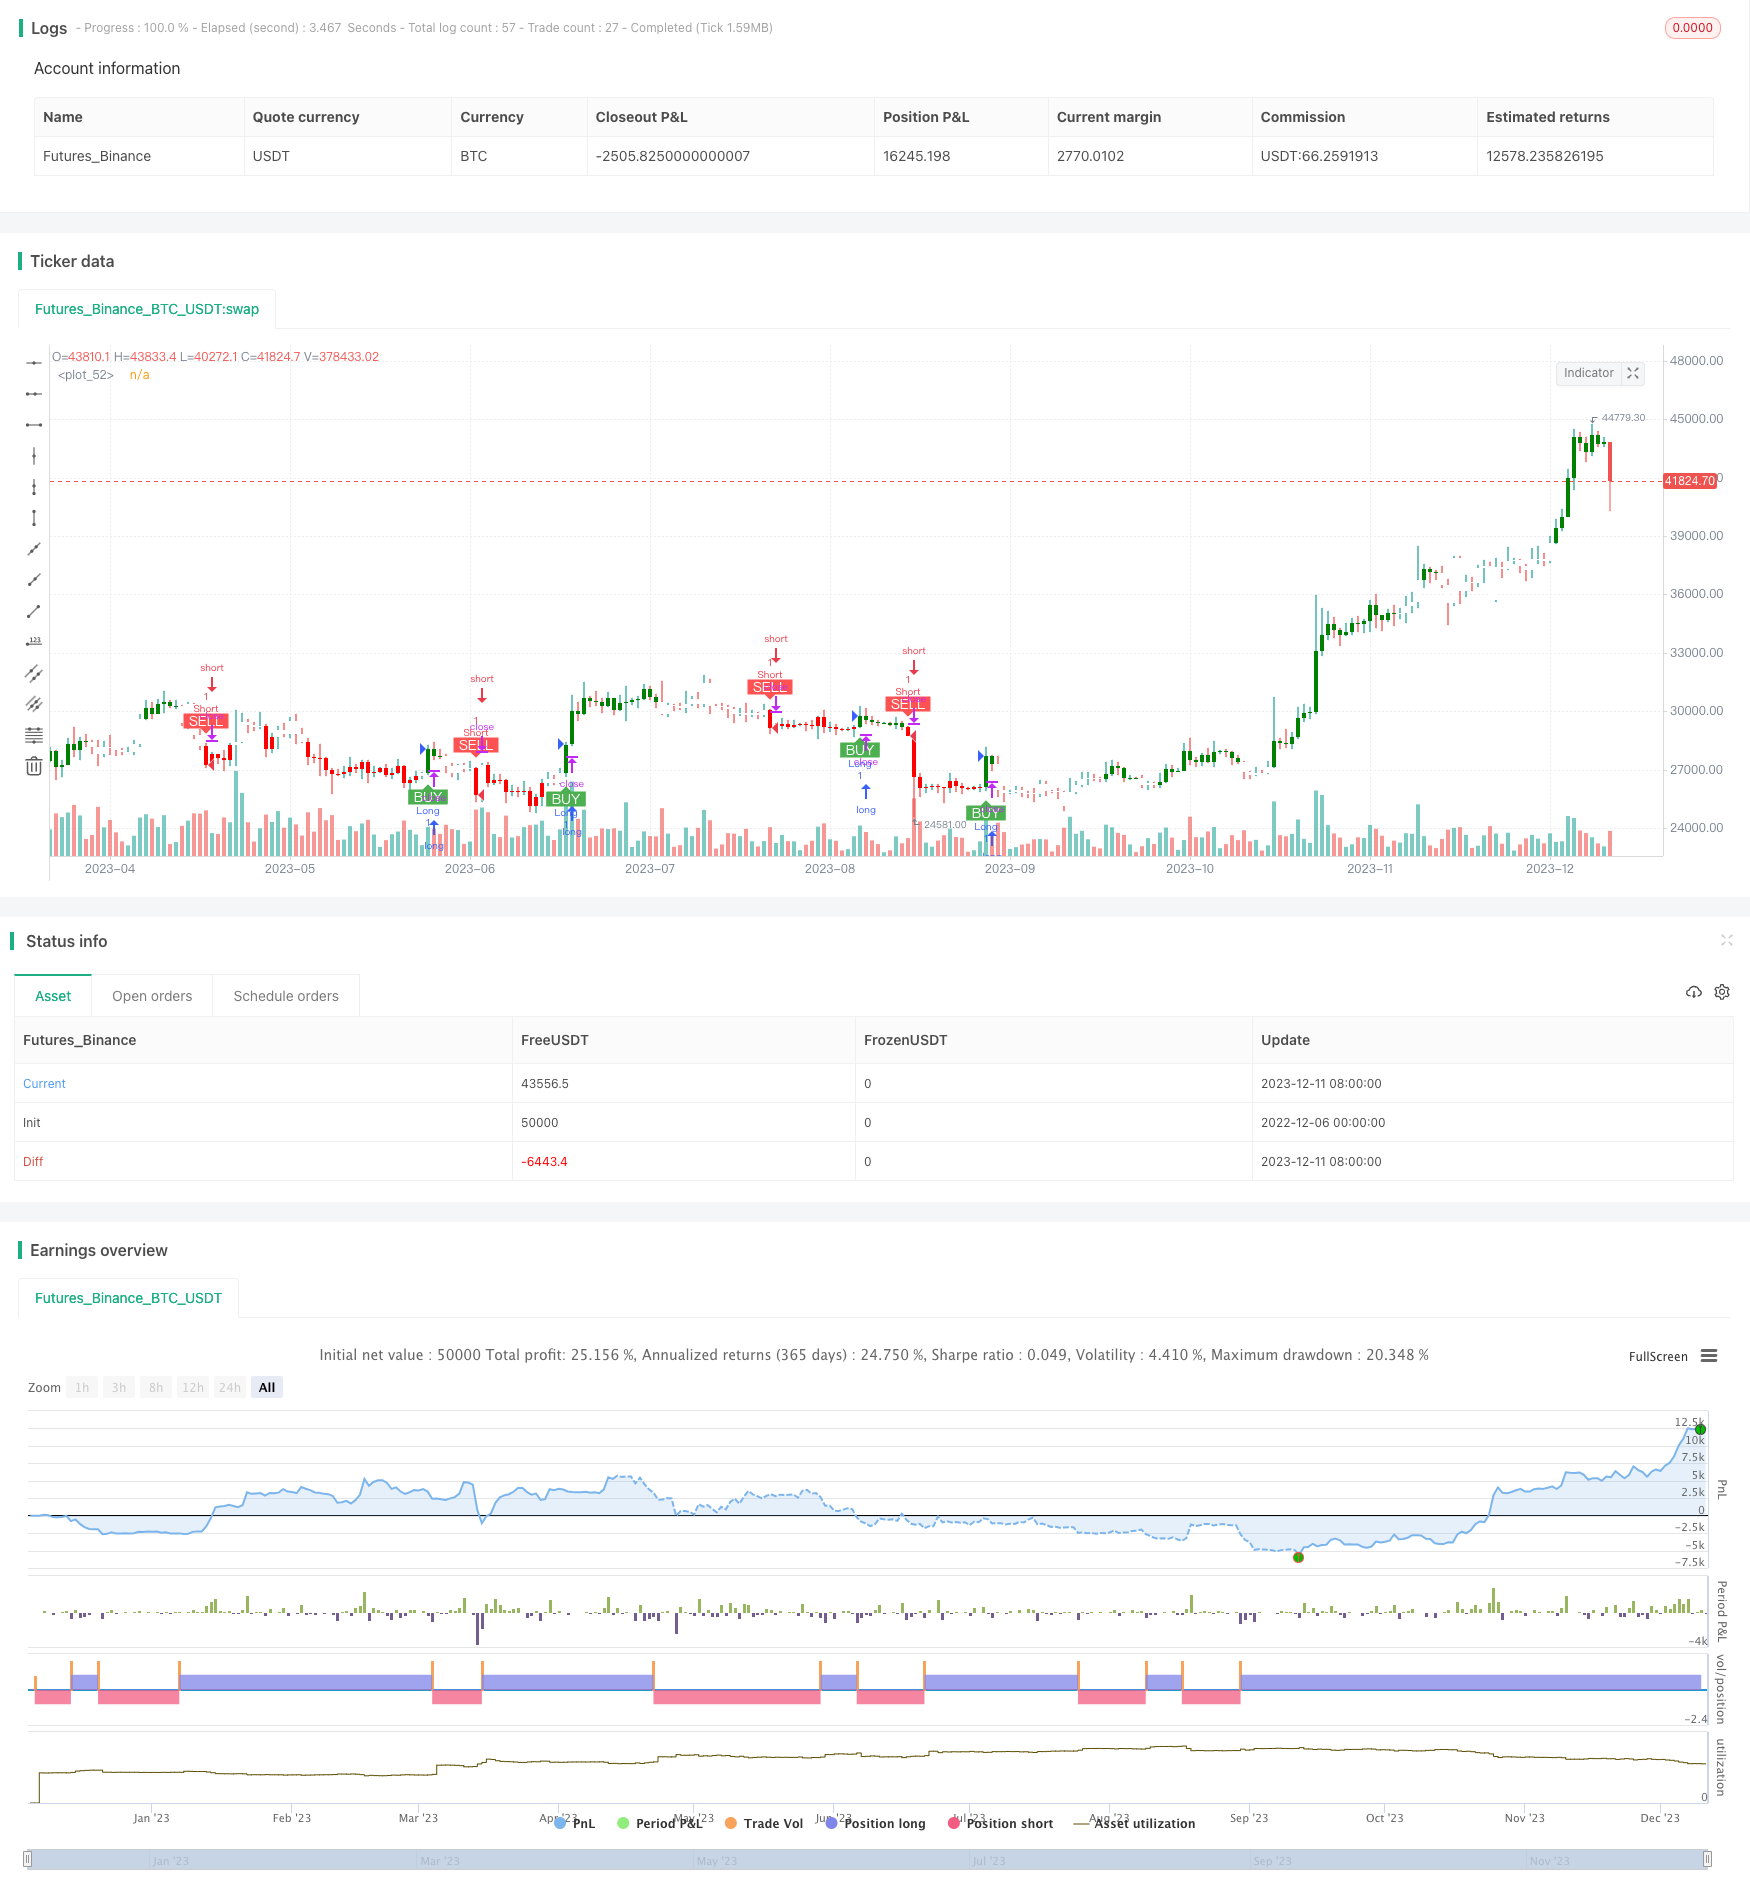
概述
该策略名为“基于ADX和MACD指标的趋势跟踪策略”,它利用平均趋向指标(ADX)判断趋势方向和力度,并结合移动平均聚散指标(MACD)的多空信号,实现趋势跟踪交易。当ADX表明存在强势趋势,且MACD发出交易信号时,该策略才会建立多头或空头头寸。
策略原理
该策略通过计算ADX和+DI、-DI曲线,判断市场趋势方向和强度。当+DI曲线上穿-DI曲线时为多头市场,当-DI曲线下穿+DI曲线时为空头市场。仅仅如此还不够,当ADX值大于20时,说明趋势足够强劲,这时再结合MACD指标的差值(macdline)和信号值(signalline)的金叉死叉信号,买入和卖出该品种,实现趋势跟踪交易。
具体来说,策略的交易信号逻辑为:
多头信号:当+DI> -DI 且 MACD的差值线从下向上穿过信号线时 空头信号:当-DI> +DI 且 MACD的差值线从上向下穿过信号线时
根据此逻辑,该策略能够在强势趋势中捕捉较优的入场时机。
策略优势
该策略最大的优势在于,它同时考量了趋势判断和入场时机选择这两大要素,让交易者能够在市场存在较强劲的方向性时,找到比较好的入场点位,这大大提高了系统的稳定性和盈利能力。
另外,该策略还引入了止损逻辑。当头寸亏损超过用户定义的止损价格时,策略会主动止损,有效控制个别交易的损失。这也是该策略的一大亮点。
策略风险
尽管该策略有一定的优点,但也存在一些风险需要警惕:
ADX和MACD所组成的交易信号,在某些市场情况下可能会失效或产生错误信号,从而导致不必要的亏损;
用户定义的止损价格可能会被突破,造成超出预期的损失;
反转市场中,策略可能会产生过多无效交易而耗费交易成本。
为降低这些风险,建议优化ADX和MACD的参数设置,并实施严格的资金管理策略,同时调整止损逻辑以适应不同的市场情况。
策略优化方向
该策略还有一定的优化空间:
可以引入更多指标,形成更强劲的交易信号,例如结合波动率指标限制交易;
可以通过机器学习方法自动优化ADX和MACD的参数;
可以建立自适应的止损机制,让止损价格动态跟踪市场波动。
通过这些方法,有望进一步增强该策略的稳定性和盈利水平。
总结
总的来说,基于ADX和MACD指标的趋势跟踪策略,具有判断趋势方向、找到较优入场时机、设置止损逻辑等优势,是一个值得考量的交易系统。在Parameters优化和风险控制到位的情况下,该策略能够获取不错的投资回报。但交易者仍需警惕其中存在的潜在风险,并密切关注市场环境的变化。通过系统的监测和优化,该策略有望获得持续的Alpha。
/*backtest
start: 2022-12-06 00:00:00
end: 2023-12-12 00:00:00
period: 1d
basePeriod: 1h
exchanges: [{"eid":"Futures_Binance","currency":"BTC_USDT"}]
*/

//@version=5
strategy("TUE ADX/MACD Confluence V1.0", overlay=true)

showsignals = input(true, title="Show BUY/SELL Signals")
showcandlecolors = input(true, title="Show Candle Colors")
length = input(14, title="ADX Length")
smoothing = input(10, title="ADX Smoothing")
macdsource = input(close, title="MACD Source")
macdfast = input(12, title="MACD Fast Length")
macdslow = input(26, title="MACD Slow Length")
macdsignal = input(9, title="MACD Signal Length")
colorup = input(color.green, title="Up Candle Color")
colordown = input(color.red, title="Down Candle Color")

/////////////////////////////////////////////////////////////////////////////////////////////// ADX AND MACD CALC
[diplus, diminus, adx] = ta.dmi(length, smoothing)

[macdline, signalline, histline] = ta.macd(macdsource, macdfast, macdslow, macdsignal)

//////////////////////////////////////////////////////////////////////////////////////////////TRADE CALC

longcheck = diplus > diminus and macdline > signalline
shortcheck = diminus > diplus and signalline > macdline

int trade = 0

//Open from nothing

if trade == 0 and longcheck
    trade := 1

else if trade == 0 and shortcheck
    trade := -1

//Reversal

else if trade == 1 and shortcheck
    trade := -1

else if trade == -1 and longcheck
    trade := 1

//Keep status quo until crossover

else
    trade := trade[1]

//////////////////////////////////////////////////////////////////////////////////////////////PLOT

colors = longcheck ? colorup : shortcheck ? colordown : color.white

plotcandle(open, high, low, close, color = showcandlecolors ? colors : na)

plotshape(trade[1] != 1 and trade == 1 and showsignals, style=shape.labelup, text='BUY', textcolor=color.white, color=color.green, size=size.small, location=location.belowbar)
plotshape(trade[1] != -1 and trade == -1 and showsignals, style=shape.labeldown, text='SELL', textcolor=color.white, color=color.red, size=size.small, location=location.abovebar)

///////////////////////////////////////////////////////////////////////////////////////////// ALERTS

// Add Stop Loss
stopLossPrice = input(100, title="Stop Loss Price")

if trade == 1
    strategy.entry("Long", strategy.long)

if trade == -1
    strategy.entry("Short", strategy.short)

if trade == 1 and close < close[1] - stopLossPrice
    strategy.close("LongExit")

if trade == -1 and close > close[1] + stopLossPrice
    strategy.close("ShortExit")