RSI Crossover Momentum Cyclical Strategy

Overview
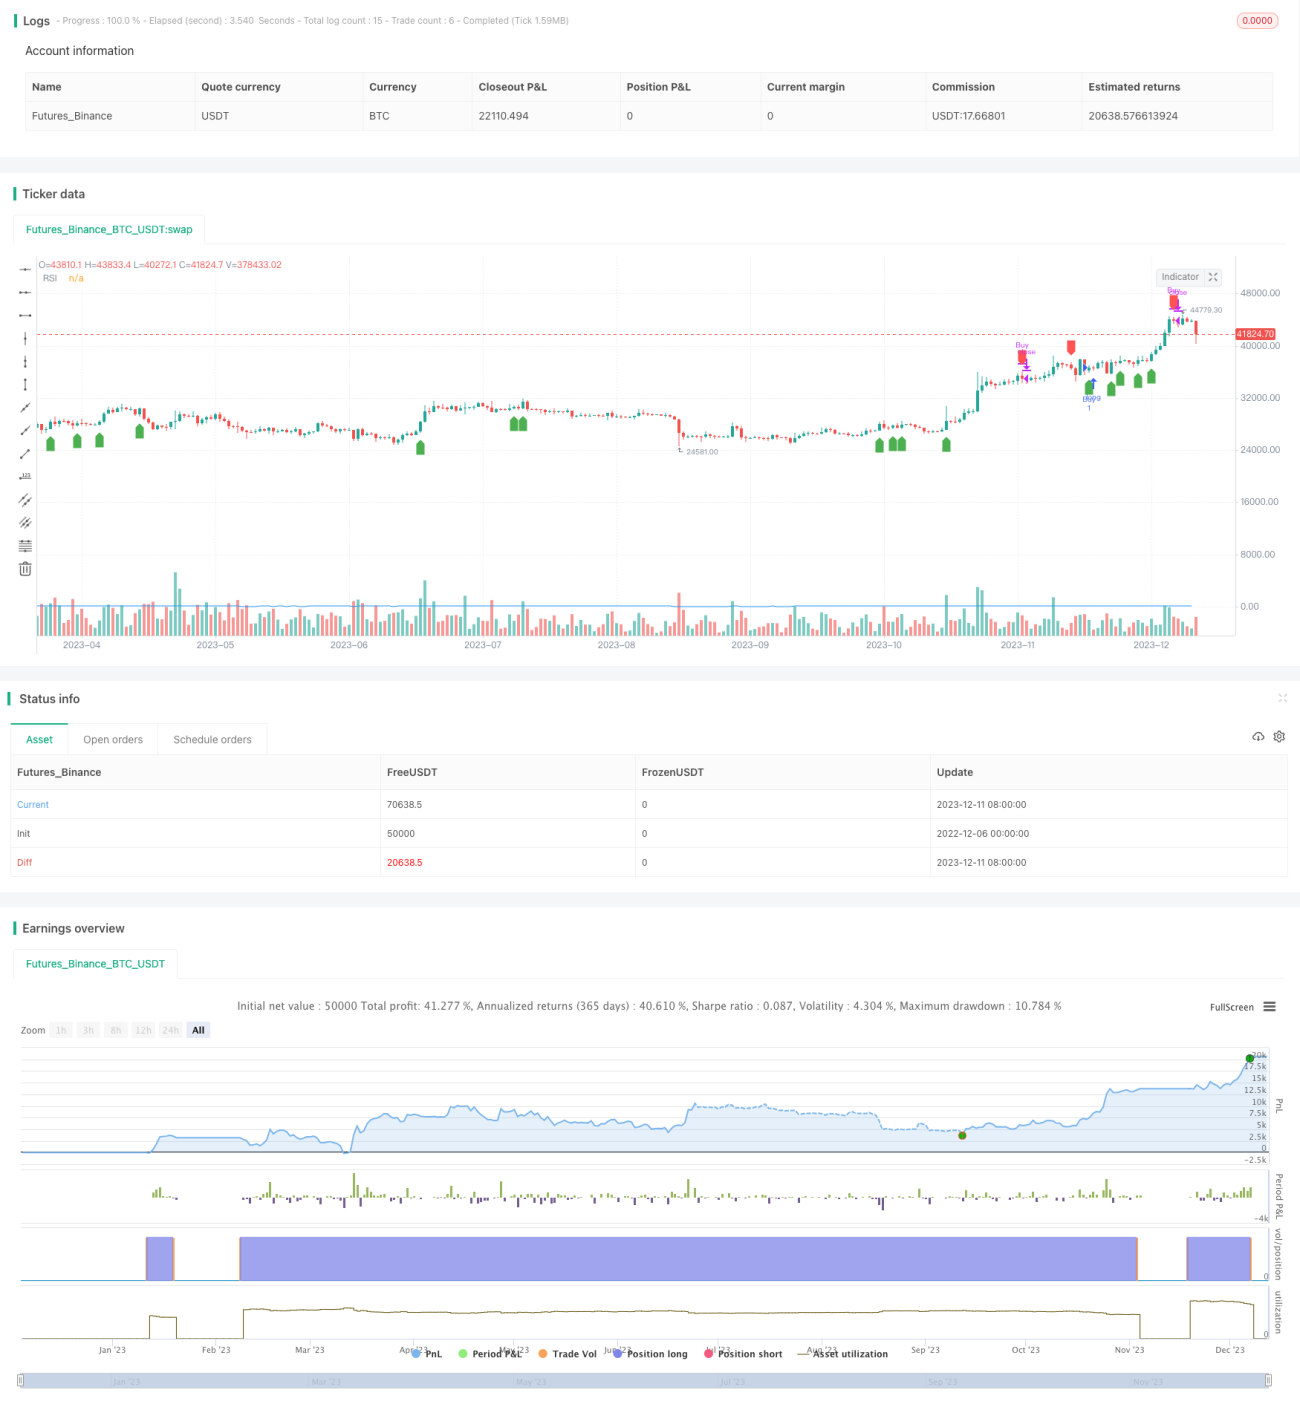
The RSI Crossover Momentum Cyclical strategy is a quantitative trading strategy based on the Relative Strength Index (RSI) indicator. It generates buy and sell signals through RSI crossovers to achieve profitable trades. Buy signals are triggered when the RSI crosses above a user-defined threshold, while sell signals are triggered when the RSI falls below the threshold, closing positions gradually at a profit.
Strategy Logic
The strategy is built upon the RSI indicator, which gauges a stock's momentum and overbought/oversold levels. It first calculates RSI values, then trades based on the relationship between the RSI and preset buy/sell thresholds.
Specifically, when the RSI crosses above the buy threshold (default 60), a buy signal is generated. The strategy would then open a long position. Later when the RSI falls below the sell threshold (default 80), a sell signal occurs. The strategy would close the existing long position accordingly. By oscillating between the two thresholds, the momentum cycles back and forth to book profits.
The strategy is written in Pine Script using clear conditional logic for entries and exits. The RSI line is plotted with markers for buy/sell signals.
Advantages
- Captures short-term trends effectively using price momentum
- Customizable RSI parameters adaptive to market changes
- Clean modern code style, easy to understand
- Intuitive visualization of RSI curve and trade signals
- Customizable thresholds catering to personal needs
Risks
- Higher risks in short-term trading, needing close monitoring
- Potential false signals and RSI divergence
- Overeager entries risking chase trades
- No stop loss mechanism to limit losses
We can set stop loss, optimize RSI parameters, or add filters to improve it.
Enhancement Opportunities
There are a few ways we can further optimize the strategy:
- Add filters like moving averages to reduce false signals
- Incorporate stop loss logic to control losses
- Optimize RSI parameters for different stocks and markets
- Develop adaptive systems that auto-adjust parameters
- Test different holding periods to find optimal combinations
Conclusion
This basic example demonstrates using RSI for quant trading. We can build on it with more indicators and risk management techniques. In practice, rigorous optimization and customization based on personal risk tolerance is needed before application. With sound methodology, this strategy can become an effective quantitative investment tool.
- 1