Dynamic Moving Average Dual Strategy

Author: ChaoZhang, Date: 2023-12-13 16:37:05
Tags:

img

Overview

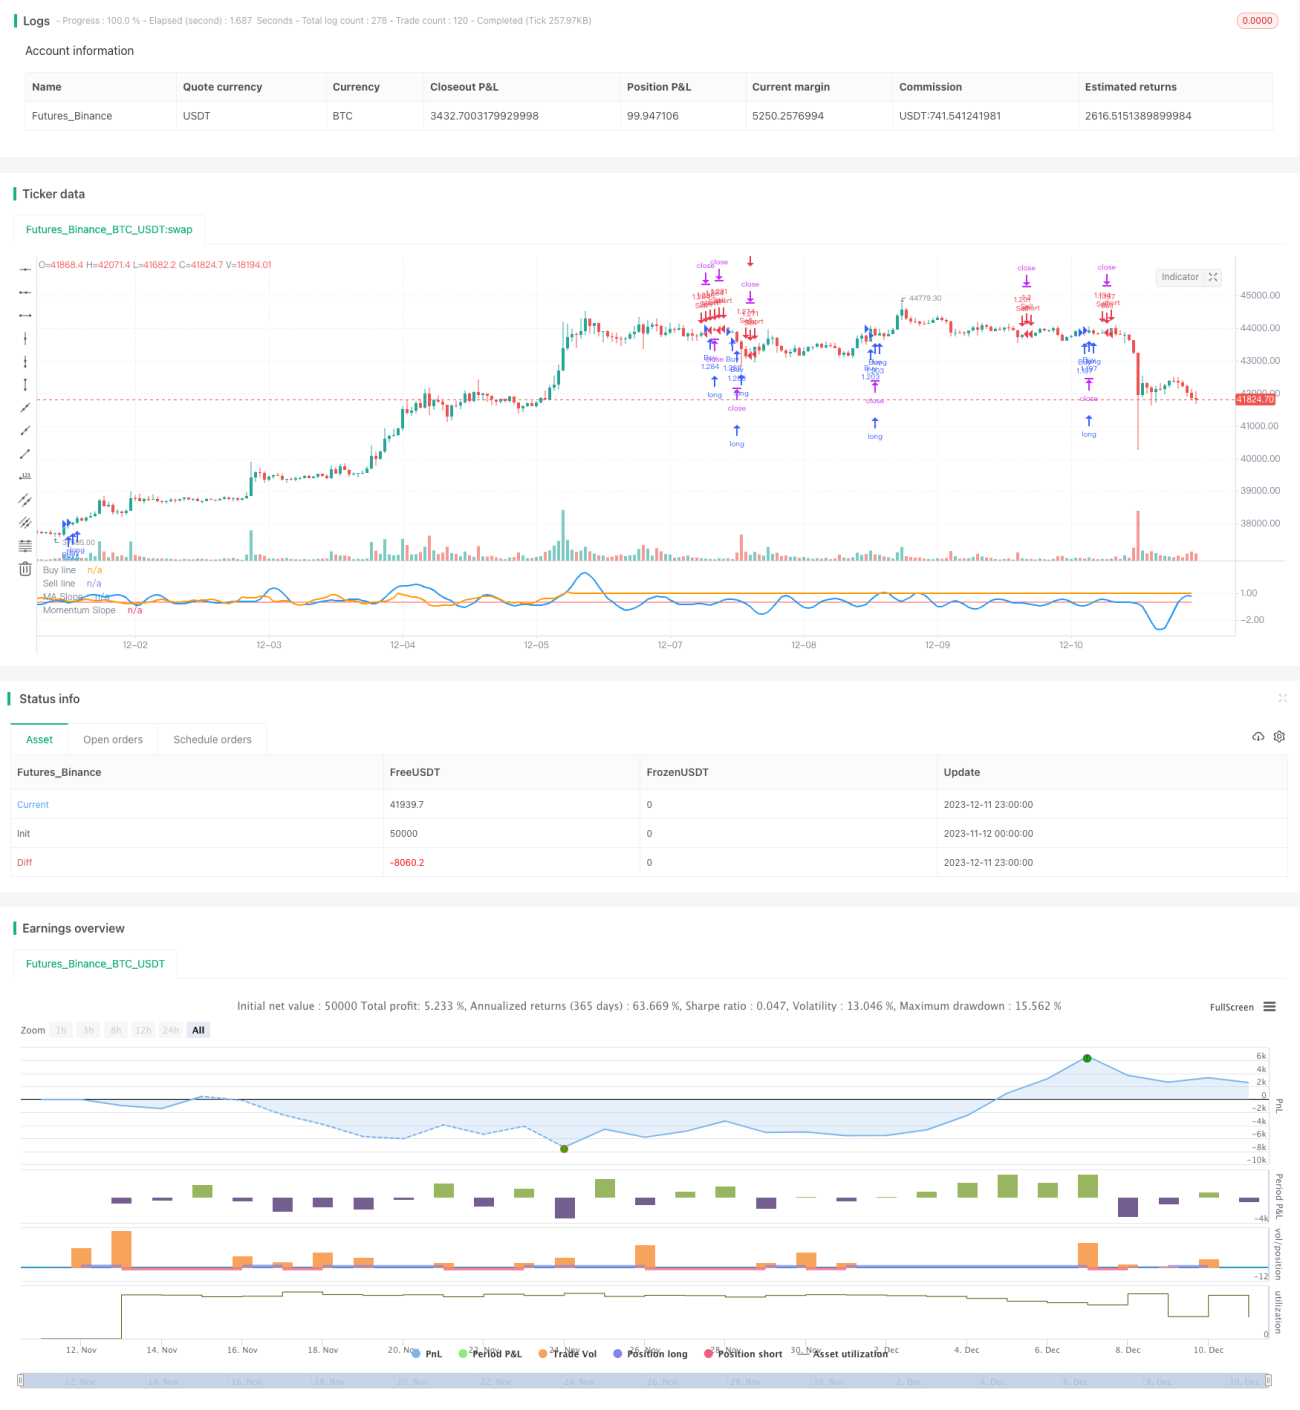
This strategy uses the slope of the Moving Average (MA) and the slope of momentum indicators for trading decisions. It compares the MA slope and momentum slope with set thresholds, and generates trading signals when both slope exceed the thresholds. The strategy also contains a low volatility filter that uses a different MA to generate signals when the market volatility is low.

Strategy Logic

The core of this strategy lies in comparing two slope curves. Firstly, it calculates the slope of the MA and momentum indicator. The slope reflects the rate of change and direction of the curve. Then two thresholds are used, when both the MA slope and the momentum slope exceed the corresponding thresholds, trading signals are generated.

For example, when both the MA slope and momentum slope exceed the upper line, a buy signal is generated; when both curves fall below the lower line, a sell signal is generated. This can filter out some false signals.

The low volatility filter uses a long-term MA to determine market volatility. When volatility is low, a MA with different parameters is used to generate trading signals to adapt to different market states.

Advantage Analysis

This strategy has the following advantages:

  1. The dual filter for setting up trading signals can filter out some noise and improve signal quality.

  2. The low volatility filter allows the strategy to adapt to different market conditions with elasticity.

  3. High customizability for different parameters can be optimized for different products.

  4. It contains no repainting function to reduce the impact from curve fitting.

Risk Analysis

This strategy also has some risks:

  1. The dual filter may filter out some real signals and miss opportunities. This can be optimized by adjusting parameters.

  2. The threshold determination of the low volatility filter needs careful testing. Improper settings may cause signal deviations.

  3. Parameter settings for MA and momentum indicators need to be optimized for specific products, and universal parameters are hard to determine.

  4. The no repainting function cannot completely avoid the backtest curve fitting problem, and real trading performance still needs verification.

  5. High customizability increases the complexity of the parameter space and the difficulty of optimization.

Optimization Directions

The strategy can be optimized in the following directions:

  1. Test more combinations of MA and momentum indicators to find the best matching indicators.

  2. Optimize the length parameters of MA and momentum indicators to balance lag and noise.

  3. Optimize the parameters for calculating slope to find more stable indicator combinations.

  4. Test different low volatility indicators and parameters to improve elasticity.

  5. Test on different products and timeframes to find the best applicable scope.

  6. Build parameter adaptive mechanisms to reduce manual optimization workload.

Conclusion

This is a very flexible and customizable dual MA strategy. It references both price and momentum information for decision making, which can effectively filter out false signals. The low volatility filter also makes the strategy more elastic to adapt to market changes.

With improvements in parameter optimization and indicator selection, this strategy can become a viable choice for real life trading. It provides a reference template for trading decisions using MA and momentum indicators.


/*backtest
start: 2023-11-12 00:00:00
end: 2023-12-12 00:00:00
period: 1h
basePeriod: 15m
exchanges: [{"eid":"Futures_Binance","currency":"BTC_USDT"}]
*/

// This source code is subject to the terms of the Mozilla Public License 2.0 at https://mozilla.org/MPL/2.0/
// © Allenlk
//@version=4
strategy("DRSI DMA Scalping Strategy", shorttitle="DRSIDMA", overlay=false, initial_capital=1000, pyramiding=2, default_qty_type=strategy.percent_of_equity, default_qty_value=100)

//Inputs
matype             = input(7, minval=1, maxval=8, title="1=SMA, 2=EMA, 3=WMA, 4=HullMA, 5=VWMA, 6=RMA, 7=TEMA, 8=Tilson T3", group="Moving Average")
masrc              = input(close, title="MA Source", group="Moving Average")
malen              = input(5, title="Moving Average Length - LookBack Period", group="Moving Average")
factorT3           = input(defval=7, title="Tilson T3 Factor - *.10 - so 7 = .7 etc.", minval=0, group="Moving Average")
maderiv            = input(3, title="MA Slope Lookback", minval=1, group="Moving Average")
masmooth           = input(5, title="MA Slope Smoothing", minval=1, group="Moving Average")
momtype            = input(3, minval=1, maxval=3, title="1=RSI, 2=CCI, 3=RSI/ROC", group="Momentum Moving Average")
momsrc             = input(close, title="Momentum Source", group="Momentum Moving Average")
momlen             = input(3, title="Momentum Length", minval=1, group="Momentum Moving Average")
momderiv           = input(8, title="Momentum Slope Lookback", minval=1, group="Momentum Moving Average")
momsmooth          = input(7, title="Momentum Slope Smoothing", minval=1, group="Momentum Moving Average")
higherTf           = input("1", title="Higher timeframe?", type = input.resolution, group="Time Resolution")
higherTfmult       = input(130, title="MA Slope multiplier for Alternate Resolutions (Make the waves of the blue line similar size as the orange line)", group="Time Resolution")
buffup             = input(0.02, title="Buy when both slopes cross this line", step=0.01, group="Buy and Sell Threshold")
bufflow            = input(-0.03, title="Sell when both slopes cross this line", step=0.01, group="Buy and Sell Threshold")
lowVolMALength     = input(28, title="Big MA Length", minval=1, group="Low Volatility Function")
MAlength           = input(10, title="Low Volatility Moving Average Length", minval=1, group="Low Volatility Function")
MAThresh           = input(0.05, title="Low Volatility Buy and Sell Threshold", step=0.01, group="Low Volatility Function")
Volminimum         = input(2.5, title="Minimum volatility to trade", minval=0, step=0.01, group="Low Volatility Function")

//Low Volatility Function
//When Volatility is low refer to the slope of a long moving average
low_vol_MA         = sma(close, lowVolMALength)
low_vol_down       = (low_vol_MA[3] - low_vol_MA[1]) > MAThresh
low_vol_up         = (low_vol_MA[3] - low_vol_MA[1]) < MAThresh * -1
percent_volatility = (1 - (low / high)) * 100
chng_MA            = sma(percent_volatility, MAlength)
bad_vol            = chng_MA < Volminimum

//No repaint function
nrp_funct(_symbol, _res, _src) => security(_symbol, _res, _src[barstate.isrealtime ? 1 : 0])

//hull ma definition
hullma = wma(2*wma(masrc, malen/2)-wma(masrc, malen), round(sqrt(malen)))

//TEMA definition
ema1 = ema(masrc, malen)
ema2 = ema(ema1, malen)
ema3 = ema(ema2, malen)
tema = 3 * (ema1 - ema2) + ema3

//Tilson T3
factor = factorT3 *.10
gd(masrc, malen, factor) => ema(masrc, malen) * (1 + factor) - ema(ema(masrc, malen), malen) * factor 
t3(masrc, malen, factor) => gd(gd(gd(masrc, malen, factor), malen, factor), malen, factor) 
tilT3 = t3(masrc, malen, factor) 
 
//MA Type 
avg = matype == 1 ? sma(masrc,malen) : matype == 2 ? ema(masrc,malen) : matype == 3 ? wma(masrc,malen) : matype == 4 ? hullma : matype == 5 ? vwma(masrc, malen) : matype == 6 ? rma(masrc,malen) : matype == 7 ? 3 * (ema1 - ema2) + ema3 : tilT3

//MA Slope Percentage
DeltaAvg      = (avg / avg[maderiv]) - 1
SmoothedAvg   = sma(DeltaAvg, masmooth) 
MAout         = nrp_funct(syminfo.tickerid, higherTf, SmoothedAvg) * higherTfmult

//Momentum indicators
Momentum = momtype == 1 ? rsi(momsrc, momlen) : momtype == 2 ? cci(momsrc, momlen) : momtype == 3 ? rsi(roc(momsrc,momlen),momlen) : na

//Momentum Slope Percentage
Deltamom = (Momentum / Momentum[momderiv]) - 1
SmoothedMom = sma(Deltamom, momsmooth) 
Momout   = nrp_funct(syminfo.tickerid, higherTf, SmoothedMom)

//Plottings
plot(buffup, color=color.green, title="Buy line")
plot(bufflow, color=color.red, title="Sell line")
plot(MAout, color=color.blue, linewidth=2, title="MA Slope")
plot(Momout, color=color.orange, linewidth=2, title="Momentum Slope")

longCondition = bad_vol ? low_vol_up : MAout > buffup and Momout > buffup
if (longCondition)
    strategy.entry("Buy", strategy.long)

shortCondition = bad_vol ? low_vol_down : MAout < bufflow and Momout < bufflow
if (shortCondition)
    strategy.entry("Sell", strategy.short)

More