Estrategia de convergencia de dirección del impulso comercial cuantitativo
Descripción general
Esta estrategia, denominada estrategia de convergencia de la dirección de la dinámica de la negociación cuantitativa, es una estrategia de negociación cuantitativa diseñada en función de los indicadores técnicos descritos por William Blau en su libro Momentum, Direction and Divergence. La estrategia se centra en los tres aspectos clave de la dinámica, la dirección y la convergencia, para determinar la dirección de la tendencia del mercado mediante el cálculo de indicadores de la dinámica de los precios de las acciones y la búsqueda de desviaciones entre los precios y los indicadores para obtener oportunidades de negociación.
Principio de estrategia
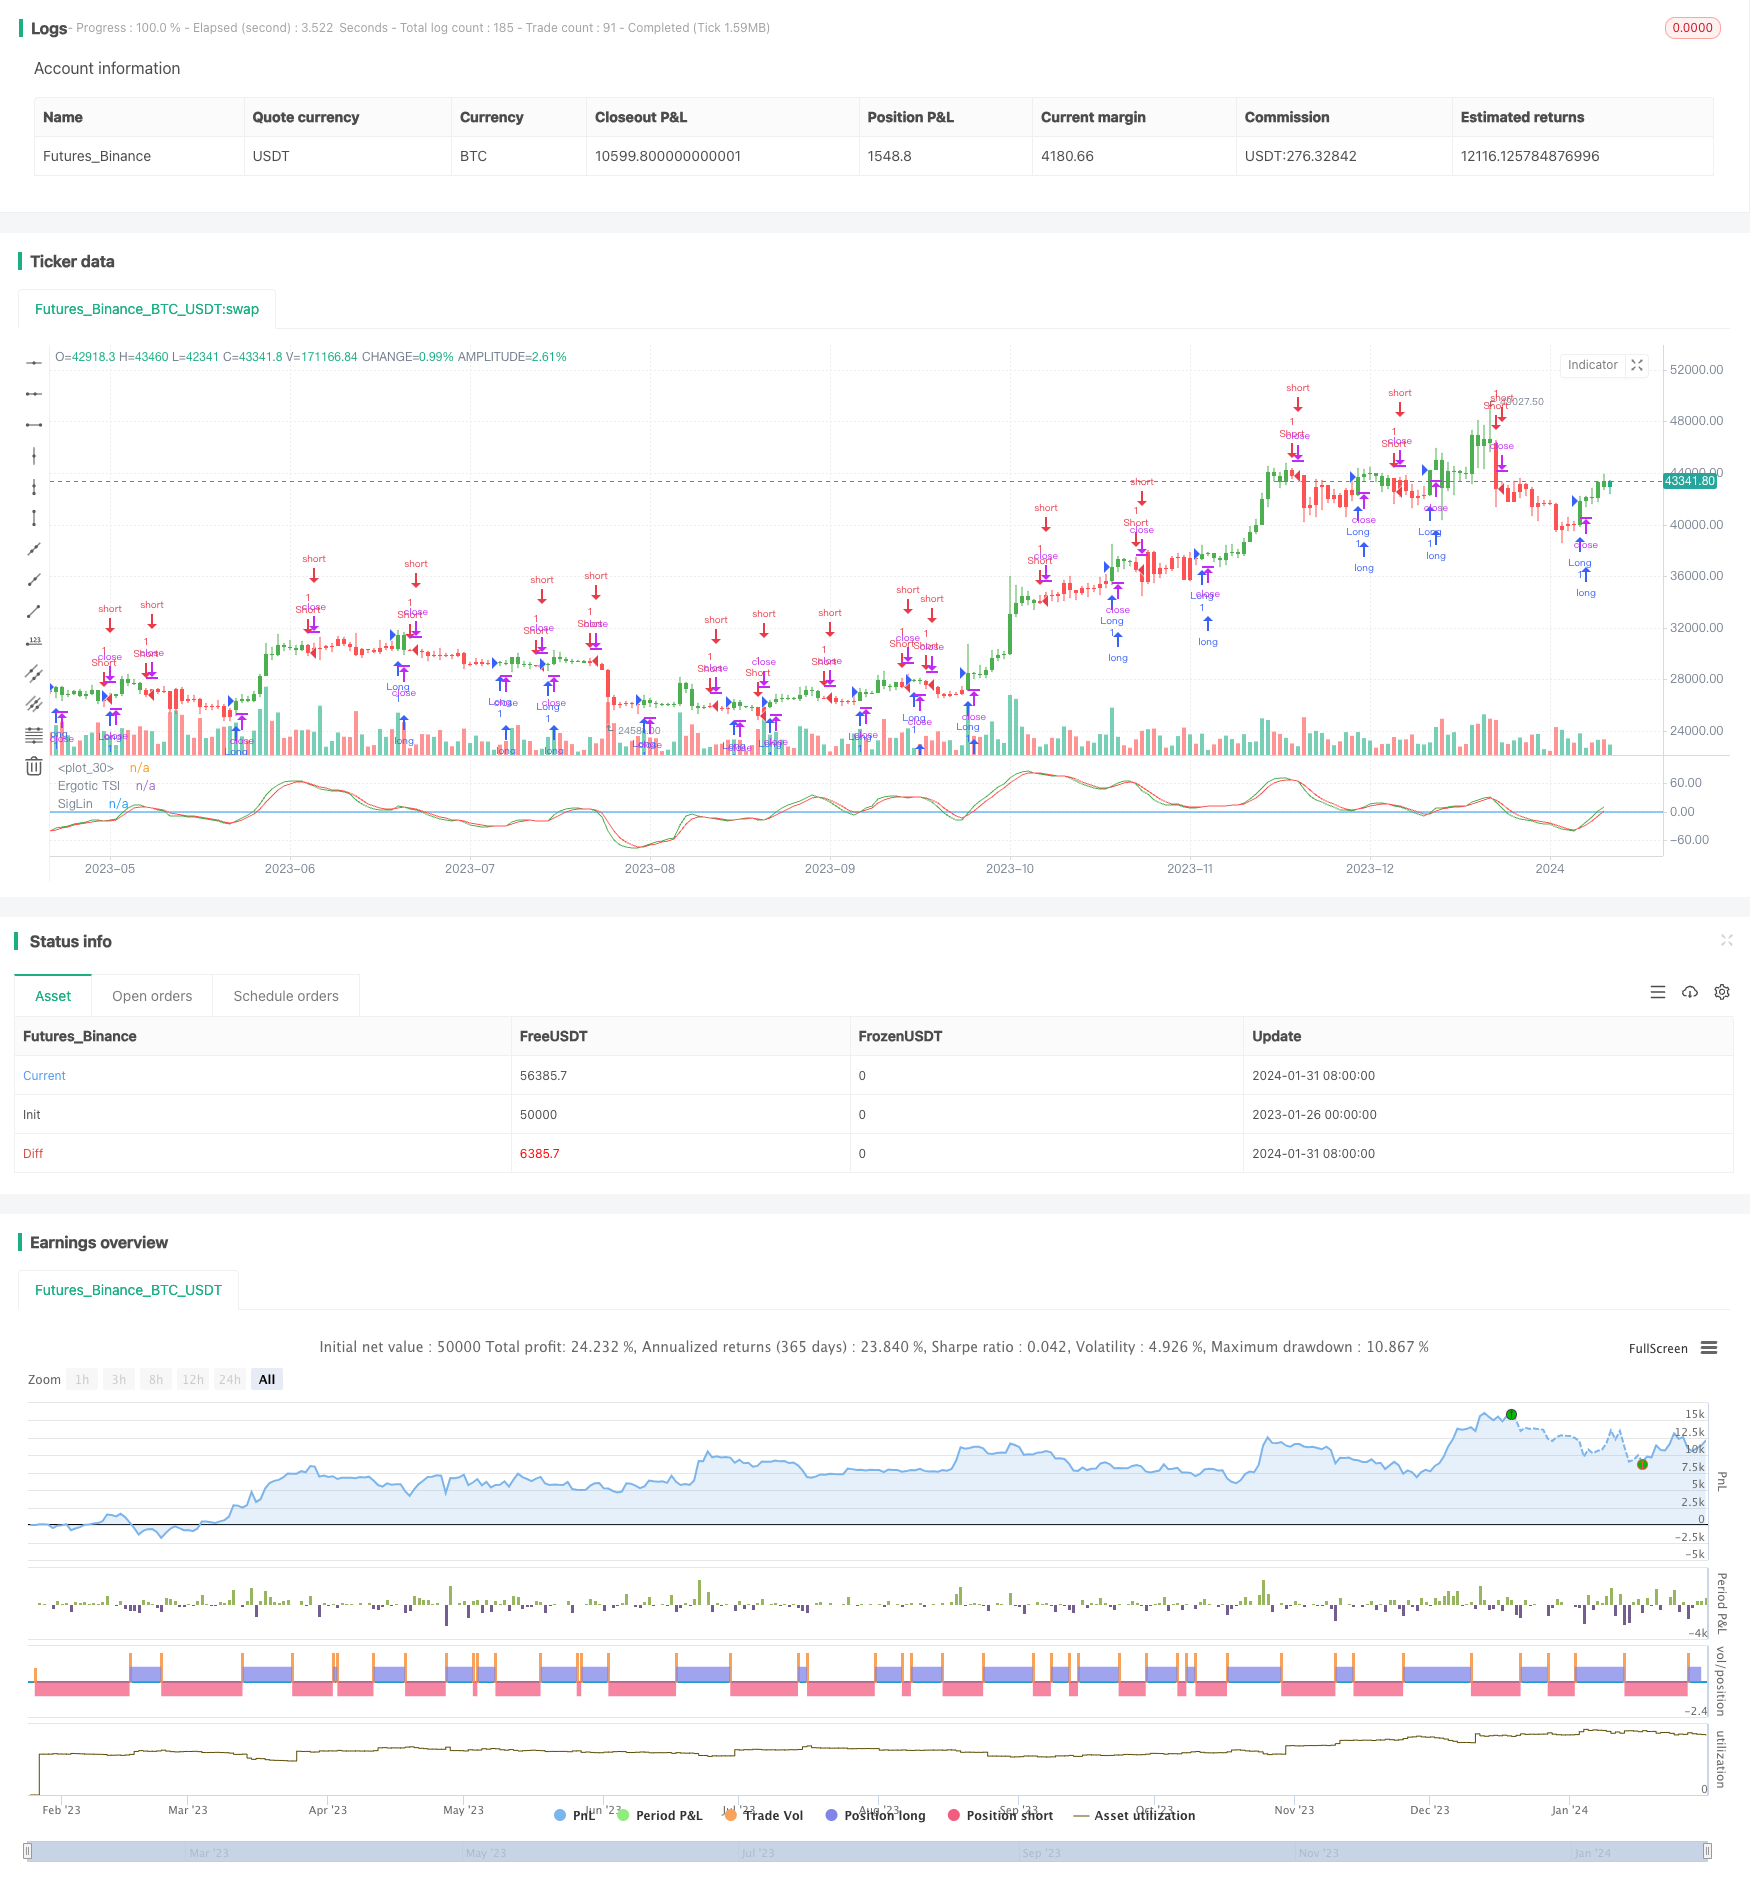
El indicador central de esta estrategia es el índice de movilidad de emergencia (ETSI ergotic), cuya fórmula de cálculo es la siguiente:
Val1 = 100 * EMA(EMA(EMA(价格变化量,r),s),u)

Val2 = EMA(EMA(EMA(价格变化量的绝对值,r),s),u)

Ergotic TSI = 如果Val2不等于0,则为Val1/Val2,否则为0
Donde, r, s, u es el parámetro de deslizamiento. Este indicador refleja la proporción de la variación de precios en el valor absoluto de la variación de precios, pertenece al indicador de oscilación dinámica. Luego, calculamos la media móvil de deslizamiento de la EMA de Ergotic TSI como la línea de señal.
Análisis de las ventajas
Las principales ventajas de esta estrategia son:
- La capacidad de capturar las tendencias de cambio de precios
- El precio de la carne de vacuno es un buen filtro para las fluctuaciones de precios.
- Con mejores características de desviación
- Ajuste de la suavidad de los parámetros con flexibilidad
Análisis de riesgos
La estrategia también tiene sus riesgos:
- Se produce una señal errónea cuando la tendencia se invierte
- La configuración incorrecta de los parámetros puede perder oportunidades de negociación o aumentar las señales falsas
- Necesidad de ajustar adecuadamente los parámetros para adaptarse a diferentes variedades y entornos de negociación
El riesgo puede ser controlado mediante la optimización de parámetros, la combinación de otros indicadores para la confirmación y el establecimiento de un stop loss.
Dirección de optimización
Esta estrategia puede ser optimizada en los siguientes aspectos:
- Prueba diferentes entradas de precios, como el precio de apertura, el precio de cierre, el precio intermedio, etc.
- Ajustar los valores de los parámetros de suavización r, s, u para encontrar la combinación óptima de parámetros
- Añadir otros indicadores o condiciones de filtrado para confirmar aún más la señal
- Establecimiento de puntos de parada y mecanismos de salida
Resumir
Esta estrategia tiene en cuenta los cambios de dinámica, el juicio de tendencias y las desviaciones de las características, para capturar de manera efectiva las oportunidades de tendencias. A través de la optimización de parámetros, el filtrado de señales y el control de riesgos, se puede obtener un mejor rendimiento de la estrategia. En general, la estrategia está diseñada de manera más razonable y merece más investigación y práctica.
/*backtest
start: 2023-01-26 00:00:00
end: 2024-02-01 00:00:00
period: 1d
basePeriod: 1h
exchanges: [{"eid":"Futures_Binance","currency":"BTC_USDT"}]
*/

//@version = 2
////////////////////////////////////////////////////////////
//  Copyright by HPotter v1.0 13/12/2016
// r - Length of first EMA smoothing of 1 day momentum        4
// s - Length of second EMA smoothing of 1 day smoothing      8
// u- Length of third EMA smoothing of 1 day momentum         6
// Length of EMA signal line                                  3
// Source of Ergotic TSI                                      Close
//
// This is one of the techniques described by William Blau in his book "Momentum,
// Direction and Divergence" (1995). If you like to learn more, we advise you to
// read this book. His book focuses on three key aspects of trading: momentum,
// direction and divergence. Blau, who was an electrical engineer before becoming
// a trader, thoroughly examines the relationship between price and momentum in
// step-by-step examples. From this grounding, he then looks at the deficiencies
// in other oscillators and introduces some innovative techniques, including a
// fresh twist on Stochastics. On directional issues, he analyzes the intricacies
// of ADX and offers a unique approach to help define trending and non-trending periods.
//
// You can use in the xPrice any series: Open, High, Low, Close, HL2, HLC3, OHLC4 and ect...
// You can change long to short in the Input Settings
// Please, use it only for learning or paper trading. Do not for real trading.
////////////////////////////////////////////////////////////
strategy(title="Ergotic TSI Strategy Backtest")
r = input(4, minval=1)
s = input(8, minval=1)
u = input(6, minval=1)
SmthLen = input(3, minval=1)
reverse = input(false, title="Trade reverse")
hline(0, color=blue, linestyle=line)
xPrice = close
xPrice1 = xPrice - xPrice[1]
xPrice2 = abs(xPrice - xPrice[1])
xSMA_R = ema(ema(ema(xPrice1,r), s),u)
xSMA_aR = ema(ema(ema(xPrice2, r), s),u)
Val1 = 100 * xSMA_R
Val2 = xSMA_aR
xTSI = iff (Val2 != 0, Val1 / Val2, 0)
xEMA_TSI = ema(xTSI, SmthLen)
pos = iff(xTSI > xEMA_TSI, 1,
	   iff(xTSI < xEMA_TSI, -1, nz(pos[1], 0)))
possig = iff(reverse and pos == 1, -1,
          iff(reverse and pos == -1, 1, pos))
if (possig == 1)
    strategy.entry("Long", strategy.long)
if (possig == -1)
    strategy.entry("Short", strategy.short)
barcolor(possig == -1 ? red: possig == 1 ? green : blue )
plot(xTSI, color=green, title="Ergotic TSI")
plot(xEMA_TSI, color=red, title="SigLin")