Estrategia de seguimiento de tendencias de cruce de DEMA
Descripción general
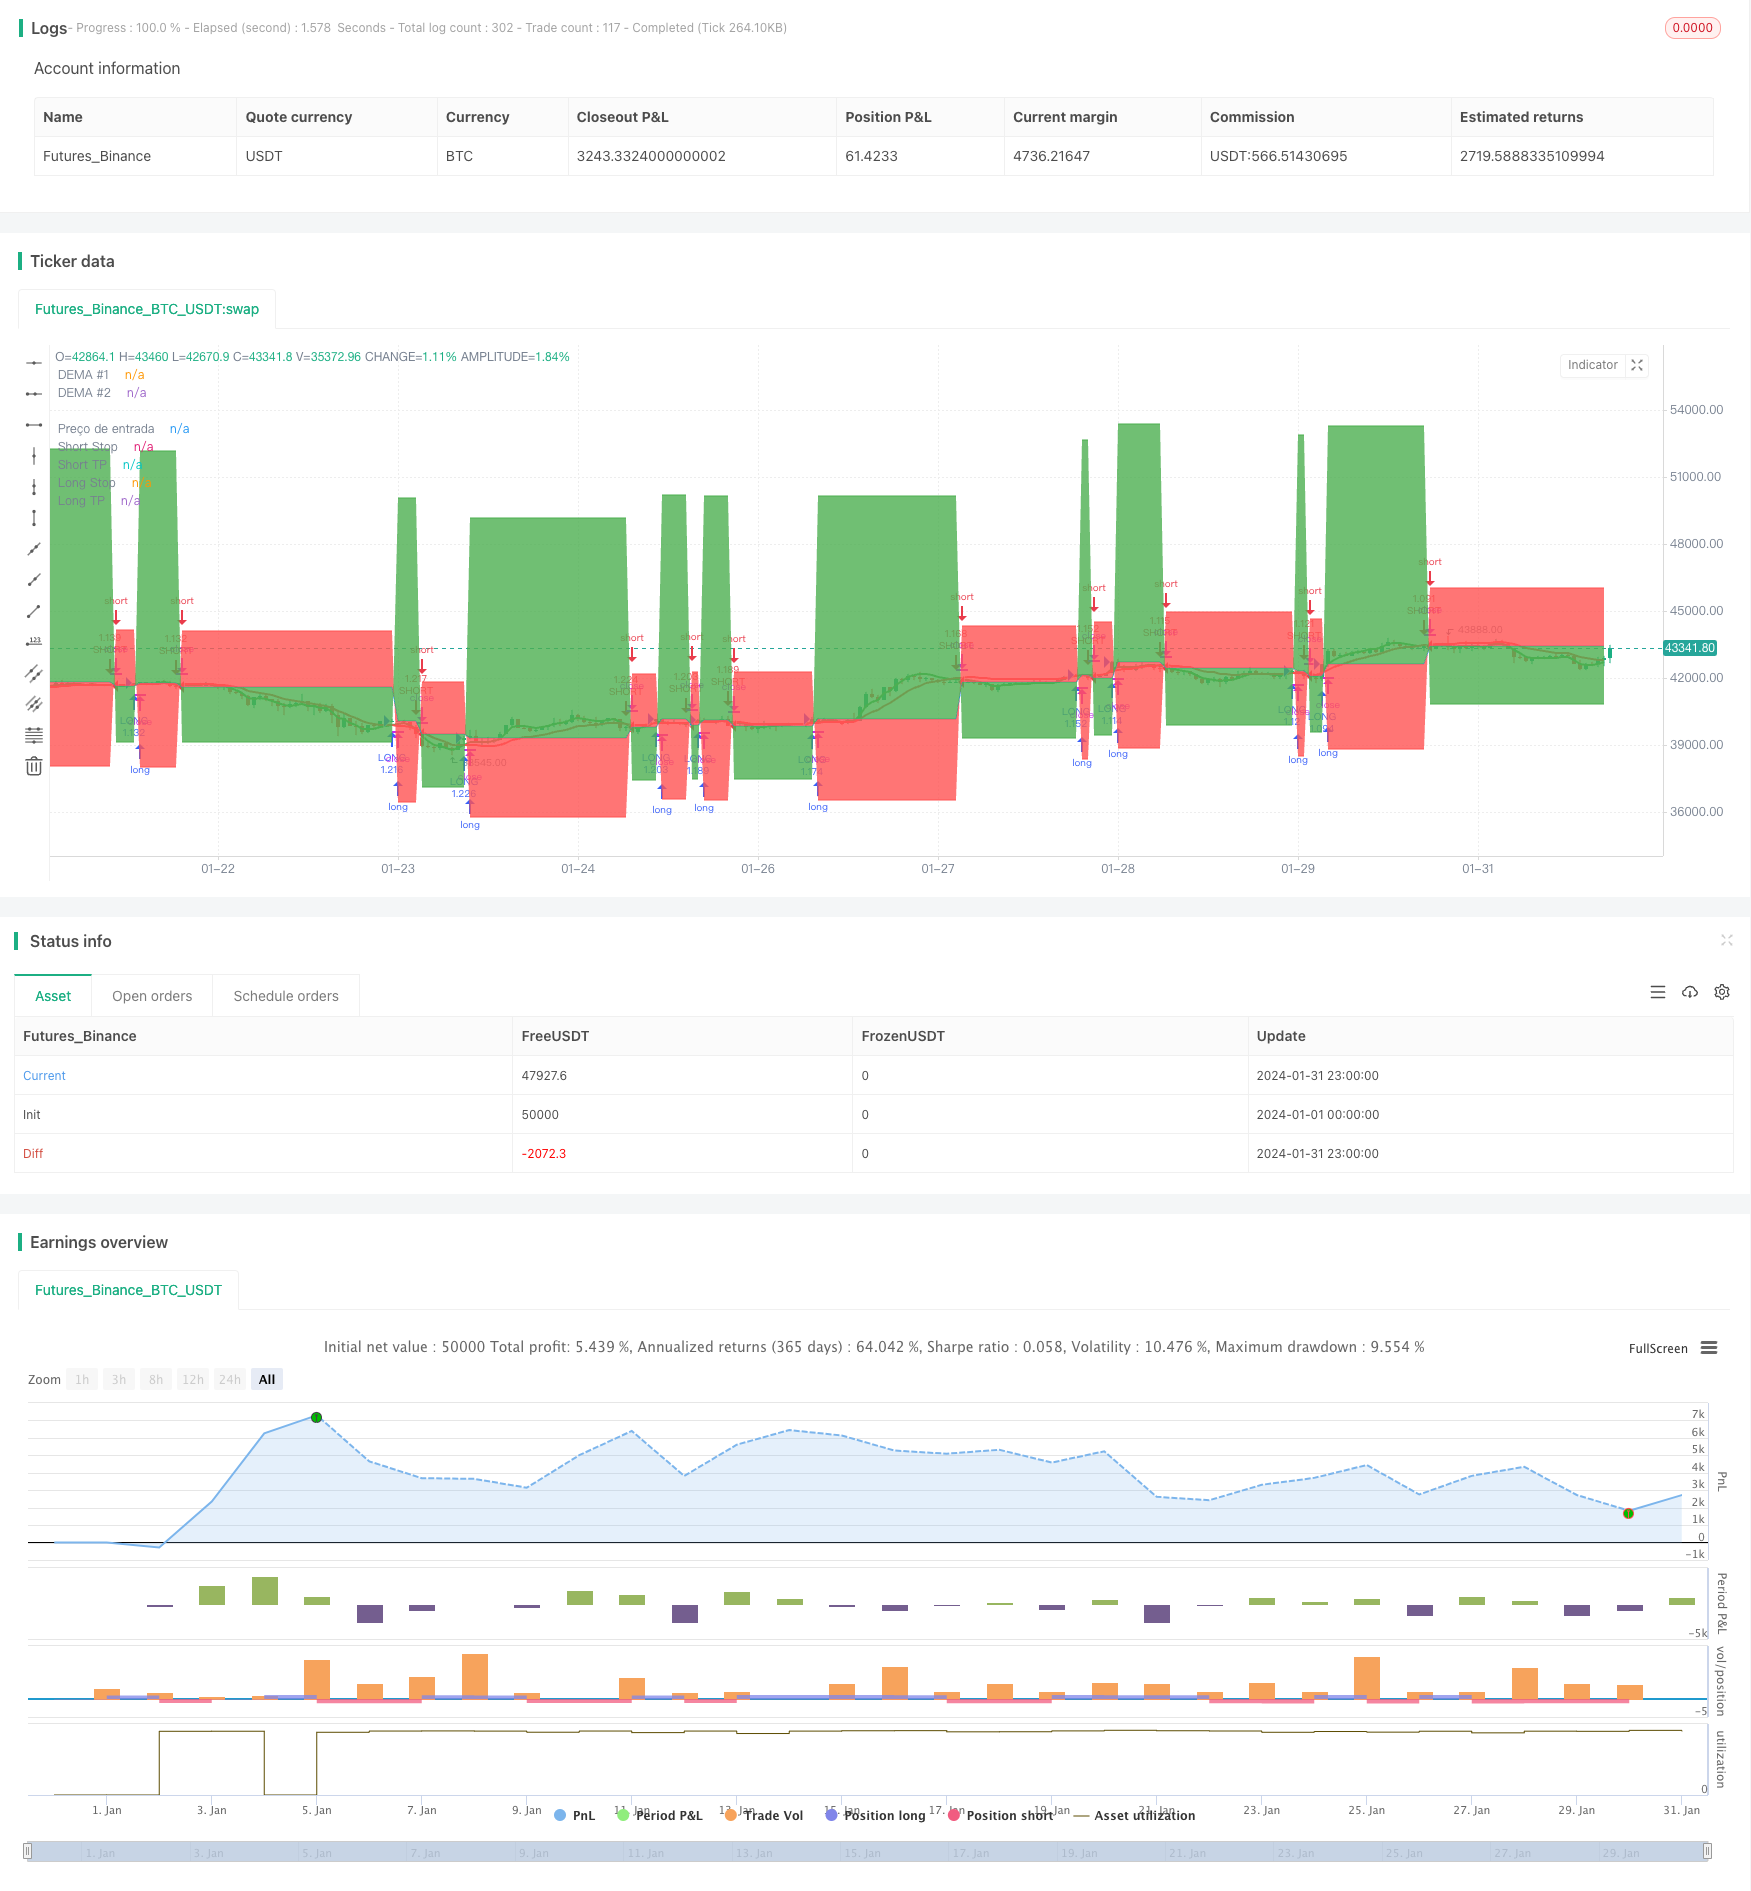
La estrategia se basa en el cruce de las medias móviles binarias (DEMA) como señal de negociación, adopta un método de seguimiento de tendencias, establece automáticamente paros y paros. La estrategia tiene la ventaja de que las señales de negociación son claras y los paros de parada son flexibles y pueden controlar el riesgo de manera efectiva.
Principio de estrategia
Calcula la línea rápida DEMA ((8 días), la línea lenta DEMA ((24 días) y la línea auxiliar DEMA ((configurable) }}.
Cuando la línea rápida atraviesa la línea lenta para generar una señal de horquilla dorada, haga más; cuando la línea rápida atraviesa la línea lenta para generar una señal de horquilla muerta, haga vacío.
Se añade un filtro de señales de transacción, que genera señales solo cuando el valor de la línea auxiliar es más alto que el valor del día anterior, para evitar falsas rupturas.
El mecanismo de seguimiento de la tendencia utiliza un Stop Loss que se ajusta a la movilidad de los precios, asegurando que el Stop Loss bloquee parte de las ganancias.
Al mismo tiempo, se establecen paros y paradas de proporción fija para controlar la máxima pérdida y ganancia de una sola operación.
Ventajas estratégicas
Las señales de intercambio son claras, lo que facilita la hora de entrar y salir.
El doble algoritmo DEMA es más suave, evita ser optimizado en exceso y la señal es más confiable.
El filtro auxiliar de la línea aumenta la eficacia de la señal de juicio y reduce las señales falsas.
La adopción de un stop loss de seguimiento de tendencias puede bloquear parte de las ganancias y controlar el riesgo de manera efectiva.
Establezca un Stop Loss de proporción fija para controlar el máximo de pérdidas en una sola operación y evitar el exceso de riesgo.
Riesgo estratégico
En situaciones de crisis, puede producirse un comercio frecuente, que puede aumentar la posición y causar pérdidas estratégicas.
La proporción de pérdidas fijas establecida es demasiado grande y puede desencadenar pérdidas grandes en circunstancias excepcionales.
El retraso en la señal de cruce de DEMA aumenta el riesgo de pérdidas al comprar cerca de los máximos en el mercado rápido.
En la implementación de discos rígidos, los costos de los puntos de deslizamiento afectan a la rentabilidad y se requiere ajustar los parámetros de stop-loss.
Optimización de la estrategia
Los parámetros de DEMA se pueden ajustar según las condiciones del mercado para encontrar el punto de equilibrio óptimo.
En el disco físico, se debe considerar el costo del punto de deslizamiento y ampliar adecuadamente el rango de pérdidas fijas.
Se pueden agregar otros indicadores auxiliares de juicio, como el MACD, para mejorar la eficacia de la señal.
Se puede configurar el seguimiento del paso de stop loss para optimizar la lógica de stop loss.
Resumir
La estrategia utiliza la capacidad de juicio de la tendencia de DEMA, en combinación con el mecanismo de seguimiento de la tendencia para controlar el riesgo, es muy representativo de la estrategia de comercio en el sistema de determinación de la dirección de la tendencia. En general, la estrategia de señales claras, el cierre de pérdidas de la configuración es razonable, es una estrategia de comercio fácil de dominar, el riesgo de control.
/*backtest
start: 2024-01-01 00:00:00
end: 2024-01-31 23:59:59
period: 1h
basePeriod: 15m
exchanges: [{"eid":"Futures_Binance","currency":"BTC_USDT"}]
*/

// This source code is subject to the terms of the Mozilla Public License 2.0 at https://mozilla.org/MPL/2.0/
// © zeguela
//@version=4
strategy(title="ZEGUELA DEMABOT", commission_value=0.063, commission_type=strategy.commission.percent, initial_capital=100, default_qty_value=90, default_qty_type=strategy.percent_of_equity, overlay=true, process_orders_on_close=true)

// Step 1. Script settings

// Input options
srcData = input(title="Source Data", type=input.source, defval=close)

// Length settings
len1 = input(title="Length DEMA #1", type=input.integer, defval=8, minval=1)
len2 = input(title="Length DEMA #2", type=input.integer, defval=24, minval=0)
len3 = input(title="Length DEMA #3", type=input.integer, defval=0, minval=0)

// Step 2. Calculate indicator values
// Function that calculates the DEMA
DEMA(series, length) =>
    if (length > 0)
        emaValue = ema(series, length)
        2 * emaValue - ema(emaValue, length)
    else
        na

// Calculate the DEMA values
demaVal1 = DEMA(srcData, len1)
demaVal2 = DEMA(srcData, len2)
demaVal3 = DEMA(srcData, len3)

// Step 3. Determine indicator signals
// See if there's a DEMA crossover
demaCrossover = if (len2 > 0) and (len3 > 0)
    crossover(demaVal1, demaVal2) and (demaVal3 > demaVal3[1])
else
    if (len2 > 0) and (len3 == 0)
        crossover(demaVal1, demaVal2)
    else
        if (len3 > 0) and (len2 == 0)
            crossover(demaVal1, demaVal3)
        else
            crossover(close, demaVal1)

// Check if there's a DEMA crossunder
demaCrossunder = if (len2 > 0) and (len3 > 0)
    crossunder(demaVal1, demaVal2) and (demaVal3 < demaVal3[1])
else
    if (len2 > 0) and (len3 == 0)
        crossunder(demaVal1, demaVal2)
    else
        if (len3 > 0) and (len2 == 0)
            crossunder(demaVal1, demaVal3)
        else
            crossunder(close, demaVal1)

// Step 4. Output indicator data
// Plot DEMAs on the chart
plot(series=demaVal1, color=color.green, linewidth=2, title="DEMA #1")
plot(series=demaVal2, color=color.red, linewidth=2, title="DEMA #2")
plot(series=demaVal3, color=color.fuchsia, linewidth=2, title="DEMA #3")

//TRAILING STOP CODE
a = input(title="Usar Trailing Stop?", type=input.bool, defval=false)

stopPerlong = input(9.0, title='Stop Loss Long %', type=input.float, group="Stop Loss & Take Profit Settings") / 100
stopPershort = input(6.0, title='Stop Loss Short %', type=input.float, group="Stop Loss & Take Profit Settings") / 100
take1Perlong = input(25.0, title='Take Profit Long % 1', type=input.float, group="Stop Loss & Take Profit Settings") / 100
take1Pershort = input(6.0, title='Take Profit Short % 1', type=input.float, group="Stop Loss & Take Profit Settings") / 100

// Determine stop loss price
longStopPrice  = strategy.position_avg_price * (1 - stopPerlong)
shortStopPrice = strategy.position_avg_price * (1 + stopPershort)
longTake1Price = strategy.position_avg_price * (1 + take1Perlong)
shortTake1Price = strategy.position_avg_price * (1 - take1Pershort)

// Determine trail stop loss prices

longStopPriceTrail = 0.0

longStopPriceTrail := if (strategy.position_size > 0)
    stopValue = close * (1 - stopPerlong)
    max(stopValue, longStopPriceTrail[1])
else
    0

// Determine trailing short price
shortStopPriceTrail = 0.0

shortStopPriceTrail := if (strategy.position_size < 0)
    stopValue = close * (1 + stopPershort)
    min(stopValue, shortStopPriceTrail[1])
else
    999999

//calcular qual stop usar
longStop = a ? longStopPriceTrail : longStopPrice
shortStop = a ? shortStopPriceTrail : shortStopPrice


//calcula o valor do stop e TP pra lançar no alerta
longStopEntrada = close  * (1 - stopPerlong)
shortStopEntrada = close  * (1 + stopPershort)
longTPEntrada = close * (1 + take1Perlong)
shortTPEntrada = close * (1 - take1Pershort)

//armazena o preço de entrada e valor do SL e TP

price_entryL = 0.0
price_entryL := na(price_entryL) ? na : price_entryL[1]
price_entryS = 0.0
price_entryS := na(price_entryS) ? na : price_entryS[1]
stopL = 0.0
stopL := na(stopL) ? na : stopL[1]
stopS = 0.0
stopS := na(stopS) ? na : stopS[1]
takeL = 0.0
takeL := na(takeL) ? na : takeL[1]
takeS = 0.0
takeS := na(takeS) ? na : takeS[1]

if (demaCrossover)
    price_entryL := close
    stopL := close  * (1 - stopPerlong)
    takeL := close * (1 + take1Perlong)

if (demaCrossunder)
    price_entryS := close
    stopS := close  * (1 + stopPershort)
    takeS := close * (1 - take1Pershort)

resultadoL = ((close - price_entryL)/price_entryL) * 100
resultadoLexit = "(SL = 1% e TP = 0,5%)"
resultadoS = ((price_entryS - close)/price_entryS) * 100
resultadoSexit = "(SL = 1% e TP = 0,5)%"
// Make input options that configure backtest date range
_startDate = input(title="Start Date", type=input.integer,
     defval=1, minval=1, maxval=31, group="BackTest Period")
_startMonth = input(title="Start Month", type=input.integer,
     defval=1, minval=1, maxval=12, group="BackTest Period")
_startYear = input(title="Start Year", type=input.integer,
     defval=2018, minval=1800, maxval=2100, group="BackTest Period")

_endDate = input(title="End Date", type=input.integer,
     defval=31, minval=1, maxval=31, group="BackTest Period")
_endMonth = input(title="End Month", type=input.integer,
     defval=12, minval=1, maxval=12, group="BackTest Period")
_endYear = input(title="End Year", type=input.integer,
     defval=2031, minval=1800, maxval=2100, group="BackTest Period")

// Look if the close time of the current bar
// falls inside the date range
_inDateRange = (time >= timestamp(syminfo.timezone, _startYear,
         _startMonth, _startDate, 0, 0)) and
     (time < timestamp(syminfo.timezone, _endYear, _endMonth, _endDate, 0, 0))

//Alert configuration

_alertMessageOpenLong="OpenLong"
_alertMessageCloseLong="CloseLong"
_alertmessageExitLong="ExitLong - TP/SL"

_alertMessageOpenShort="OpenShort"
_alertMessageCloseShort="CloseShort"
_alertMessageExitShort="ExitShort - TP/SL"

if (_inDateRange)
    //ENTER SOME SETUP TRADES FOR TSL EXAMPLE
    if (demaCrossover)
        strategy.entry("LONG", strategy.long, comment = _alertMessageOpenLong)
    if (demaCrossunder)
        strategy.entry("SHORT", strategy.short, comment = _alertMessageOpenShort)
    //EXIT TRADE @ TSL
    if strategy.position_size > 0
        strategy.exit("TP/SL", "LONG", stop=longStop, limit=longTake1Price, comment=_alertmessageExitLong, alert_message=_alertmessageExitLong)
    if strategy.position_size < 0
        strategy.exit("TP/SL", "SHORT", stop=shortStop, limit=shortTake1Price, comment =_alertMessageExitShort, alert_message=_alertMessageExitShort)


//Look & Feel - Plot stop loss and take profit areas
p1=plot(strategy.position_avg_price, color=color.blue, style=plot.style_linebr, linewidth=1, title="Preço de entrada")
p2=plot(series=strategy.position_size > 0 ? longStop : na, color=color.red, style=plot.style_linebr, linewidth=1, title="Long Stop")
p3=plot(series=strategy.position_size > 0 ? longTake1Price : na, color=color.green, style=plot.style_linebr, linewidth=1, title="Long TP")
p4=plot(series=strategy.position_size < 0 ? shortStop : na, color=color.red, style=plot.style_linebr, linewidth=1, title="Short Stop")
p5=plot(series=strategy.position_size < 0 ? shortTake1Price : na, color=color.green, style=plot.style_linebr, linewidth=1, title="Short TP")
fill(p1, p2, color=color.red)
fill(p1, p3, color=color.green)
fill(p1, p4, color=color.red)
fill(p1, p5, color=color.green)

// Insert label with value
stopLossOnLong = "Stop Loss = " + tostring(longStop)
stopLossOnShort = "Stop Loss = " + tostring(shortStop)
takeprofitOnLong = "Take Profit = " + tostring(longTake1Price)
takeprofitOnShort = "Take Profit = " + tostring(shortTake1Price)
precoentrada = "Entrada = " + tostring(strategy.position_avg_price)

var label FinalLabelpriceL = na
var label FinalLabelpriceS = na
var label slFinalLabelL = na
var label slFinalLabelS = na
var label slFinalLabelTPL = na
var label slFinalLabelTPS = na


//Draw entry and stop loss lines and labels

if strategy.position_size > 0

    //write the price above the end of the stoploss line
    slFinalLabelL := label.new(bar_index, longStop, stopLossOnLong, style=label.style_none, size=size.normal, textcolor=color.red)
    slFinalLabelTPL := label.new(bar_index, longTake1Price, takeprofitOnLong, style=label.style_none, size=size.normal, textcolor=color.green)
    FinalLabelpriceL := label.new(bar_index, strategy.position_avg_price, precoentrada, style=label.style_none, size=size.normal, textcolor=color.blue)

    // Delete previous label when there is a consecutive new high, as there's no line plot in that case.
    if strategy.position_size > 0[1]
        label.delete(slFinalLabelL[1])
        label.delete(slFinalLabelTPL[1])
        label.delete(FinalLabelpriceL[1])

if strategy.position_size < 0

    //write the price above the end of the stoploss line
    slFinalLabelS := label.new(bar_index, shortStop, stopLossOnShort, style=label.style_none, size=size.normal, textcolor=color.red)
    slFinalLabelTPS := label.new(bar_index, shortTake1Price, takeprofitOnShort, style=label.style_none, size=size.normal, textcolor=color.green)
    FinalLabelpriceS := label.new(bar_index, strategy.position_avg_price, precoentrada, style=label.style_none, size=size.normal, textcolor=color.blue)

    // Delete previous label when there is a consecutive new high, as there's no line plot in that case.
    if strategy.position_size < 0[1]
        label.delete(slFinalLabelS[1])
        label.delete(slFinalLabelTPS[1])
        label.delete(FinalLabelpriceS[1])


// Exit open market position when date range ends
if (not _inDateRange)
    strategy.close_all()