
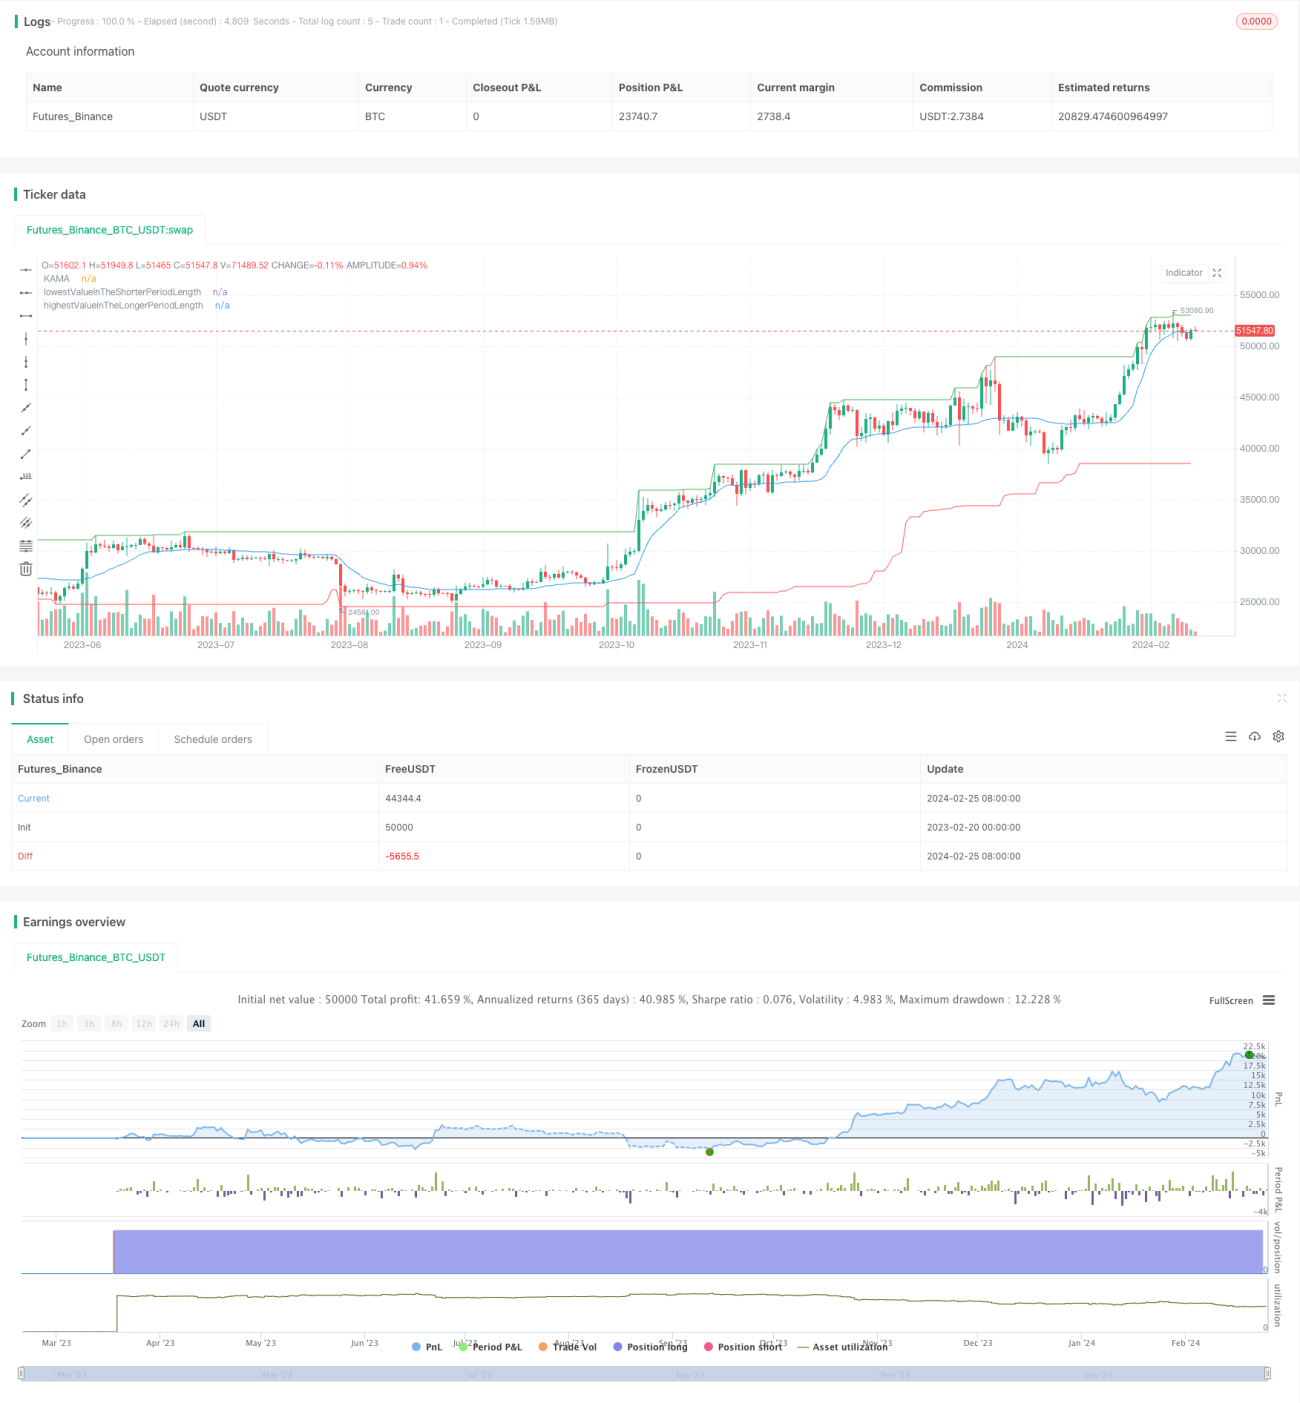
Esta es una estrategia de negociación que utiliza el canal tangencial de múltiples escalas de tiempo para determinar los puntos de entrada y salida. La idea principal de la estrategia es: determinar la dirección de la tendencia en una escala de tiempo más larga y encontrar el momento de entrada; determinar la reversión de la tendencia en una escala de tiempo más corta y encontrar el momento de salida.
La estrategia utiliza principalmente el concepto de canal de tangas. El canal de tangas se compone de líneas a lo largo, a lo largo y en el centro del canal. El ancho del canal varía con las escalas de tiempo.
La lógica de entrada: cuando el precio se rompe en la parte superior del canal de la escala de tiempo más largo, se juzga que es un momento de entrada múltiple. Para evitar falsas rupturas, requerimos que al menos una de las 3 líneas K más recientes tenga un precio de cierre de la línea K más alto que la parte superior del canal de la línea K, para evitar falsas rupturas causadas por una expansión excesiva a corto plazo.
La lógica de salida: cuando el precio cae por debajo de un canal de escala de tiempo más corto, se juzga que es el momento de salir de la posición cerrada. También se requiere que al menos una de las 3 líneas K más recientes tenga un precio de cierre de la línea K por debajo del canal de ese canal de la línea K, para confirmar la validez de la ruptura y evitar ser corregido.
La estrategia combina las ventajas de seguir una tendencia y invertir un comercio. La escala de tiempo más larga determina la dirección de la tendencia, y la escala de tiempo más corta determina la reversión local, que en combinación puede capturar la oscilación local en la tendencia.
El uso de análisis de múltiples escalas de tiempo puede ayudar a resolver mejor los problemas de brechas falsas, haciendo que las entradas y salidas sean más claras y efectivas.
Se puede adaptar a diferentes variedades y entornos de mercado a través de la optimización de parámetros.
Esta estrategia es muy sensible a los parámetros, y puede obtener resultados completamente diferentes para diferentes parámetros. Se requiere una amplia optimización de pruebas para encontrar la combinación óptima de parámetros.
En situaciones de crisis, la estrategia puede generar una gran cantidad de señales de negociación, lo que lleva a una sobrecomercialización. Se puede controlar la pérdida individual mediante la configuración de stop loss.
La estrategia no tiene en cuenta la lógica de la tendencia a gran escala, y puede fallar en los puntos de conversión de los alcistas y los osos. Se puede combinar con otros indicadores para determinar la tendencia a gran escala.
Optimización de parámetros para encontrar la combinación óptima de parámetros: duración del ciclo de optimización, tipo de canal, etc.
Aumentar la lógica de stop loss. Configurar un stop loss móvil razonable y controlar la pérdida individual.
Combinar con otros indicadores para determinar las tendencias a gran escala. Por ejemplo, EMA, K Line Channel, MAC, etc. Evite fracasar en los puntos de inflexión clave.
En general, esta estrategia es una estrategia típica de ruptura de canal en múltiples escalas de tiempo. Combina muy bien las ventajas del seguimiento de tendencias y el comercio invertido, para capturar las fluctuaciones locales en la tendencia a través del juicio de canales en diferentes escalas de tiempo. Si los parámetros están optimizados, el efecto es excelente en mercados con una tendencia evidente.
/*backtest
start: 2023-02-20 00:00:00
end: 2024-02-26 00:00:00
period: 1d
basePeriod: 1h
exchanges: [{"eid":"Futures_Binance","currency":"BTC_USDT"}]
*/
// This source code is subject to the terms of the Mozilla Public License 2.0 at https://mozilla.org/MPL/2.0/
// © venkyrocker7777
//@version=5
strategy('Donchain channel based investment strategy', shorttitle='Donchain channel strategy', overlay=true)
Length = input.int(21, minval=1)
xPrice = close
xvnoise = math.abs(xPrice - xPrice[1])
nAMA = 0.0
nfastend = 0.666
nslowend = 0.0645
nsignal = math.abs(xPrice - xPrice[Length])
nnoise = math.sum(xvnoise, Length)
nefratio = nnoise != 0 ? nsignal / nnoise : 0
nsmooth = math.pow(nefratio * (nfastend - nslowend) + nslowend, 2)
nAMA := nz(nAMA[1]) + nsmooth * (xPrice - nz(nAMA[1]))
plot(nAMA, color=color.new(color.blue, 0), title='KAMA')
// Function to get Lower Channel, Upper Channel, Middle Channel for a period length
getLCUCMC(PeriodLength) =>
lowestValueInThePeriod = ta.lowest(PeriodLength) // LC
highestValueInThePeriod = ta.highest(PeriodLength) // UC
middleChannelInTheperiod = math.avg(highestValueInThePeriod, lowestValueInThePeriod) // MC
// Returns Lower Channel, Upper Channel, Middle Channel for a period length
[lowestValueInThePeriod, highestValueInThePeriod, middleChannelInTheperiod]
// Longer time frame for entry
longerPeriod = 52
// Shorter time frame for exit
shorterPeriod = 12
if timeframe.period == 'D'
// Longer time frame for entry
longerPeriod := 52 * 5
// Shorter time frame for exit
shorterPeriod := 12 * 5
shorterPeriod
if timeframe.period == 'M'
// Longer time frame for entry
longerPeriod := 12
// Shorter time frame for exit
shorterPeriod := 3
shorterPeriod
// Get Lower Channel, Upper Channel, Middle Channel for longerPeriod, shorterPeriod
[lowestValueInTheLongerPeriodLength, highestValueInTheLongerPeriodLength, middleChannelInLongerperiod] = getLCUCMC(longerPeriod)
[lowestValueInTheShorterPeriodLength, highestValueInTheShorterPeriodLength, middleChannelInShorterperiod] = getLCUCMC(shorterPeriod)
// Plot Upper Channel of longerPeriod in dark green
plot(highestValueInTheLongerPeriodLength, 'highestValueInTheLongerPeriodLength', color=color.new(color.green, 0))
// Plot Lower Channel of shorterPeriod in dark red
plot(lowestValueInTheShorterPeriodLength, 'lowestValueInTheShorterPeriodLength', color=color.new(color.red, 0))
// Entry Plan
// Will start to see if we can enter when high crosses up longer period high (high >= highestValueInTheLongerPeriodLength)
// Check if any of the three past candles and enter when any of the 3 past candles satisfy
// 1) high of that candle >= highestValueInTheLongerPeriodLength of that candle (high[i] >= highestValueInTheLongerPeriodLength[i])
// 2) close of entry point consideration candle is above close of that candle (close > close[i])
isThisPointAnEntry() =>
// Check last 3 bars
isThisPointAnEntry = false
offset = 0
for i = 1 to 3 by 1
isCurrentCandleALongerPeriodHigh = high >= highestValueInTheLongerPeriodLength
isCurrentCandleCloseGreaterThanPreiousIthOne = close > close[i]
isPreviousIthCandleAlsoALongerPeriodHigh = high[i] >= highestValueInTheLongerPeriodLength[i]
isThisPointAnEntry := isCurrentCandleALongerPeriodHigh and isCurrentCandleCloseGreaterThanPreiousIthOne and isPreviousIthCandleAlsoALongerPeriodHigh
if isThisPointAnEntry
offset := -i
break
[isThisPointAnEntry, offset]
// Exit Plan - same as entry plan, with things reversed and also on a shorter time frame
// Will start to see if we should exit when low crosses down longer period low (low <= lowestValueInTheShorterPeriodLength)
// Check if any of the three past candles and exit when any of the 3 past candles satisfy
// 1) low of that candle <= highestValueInTheLongerPeriodLength of that candle (low[i] <= lowestValueInTheShorterPeriodLength[i])
// 2) close of exit point consideration candle is below close of that candle (close < close[i])
isThisPointAnExit() =>
// Check last 3 bars
isThisPointAnExit = false
for i = 1 to 3 by 1
isCurrentCandleAShorterPeriodLow = low <= lowestValueInTheShorterPeriodLength
isCurrentCandleCloseLesserThanPreiousIthOne = close < close[i]
isPreviousIthCandleAlsoAShorterPeriodLow = low[i] <= lowestValueInTheShorterPeriodLength[i]
isThisPointAnExit := isCurrentCandleAShorterPeriodLow and isCurrentCandleCloseLesserThanPreiousIthOne and isPreviousIthCandleAlsoAShorterPeriodLow
break
isThisPointAnExit
[isEntry, offset] = isThisPointAnEntry()
if isEntry
strategy.entry('Buy', strategy.long)
strategy.close_all(when=isThisPointAnExit() == true)
if year(timenow) == year(time) and month(timenow) == month(time) and dayofmonth(timenow) - 2 == dayofmonth(time)
strategy.close_all()