Les résultats de l'analyse sont publiés dans le rapport annuel annuel annuel.
Auteur:ChaoZhang est là., Date: 23 mai 2022 à 11h45Les étiquettes:Le taux d'intérêt
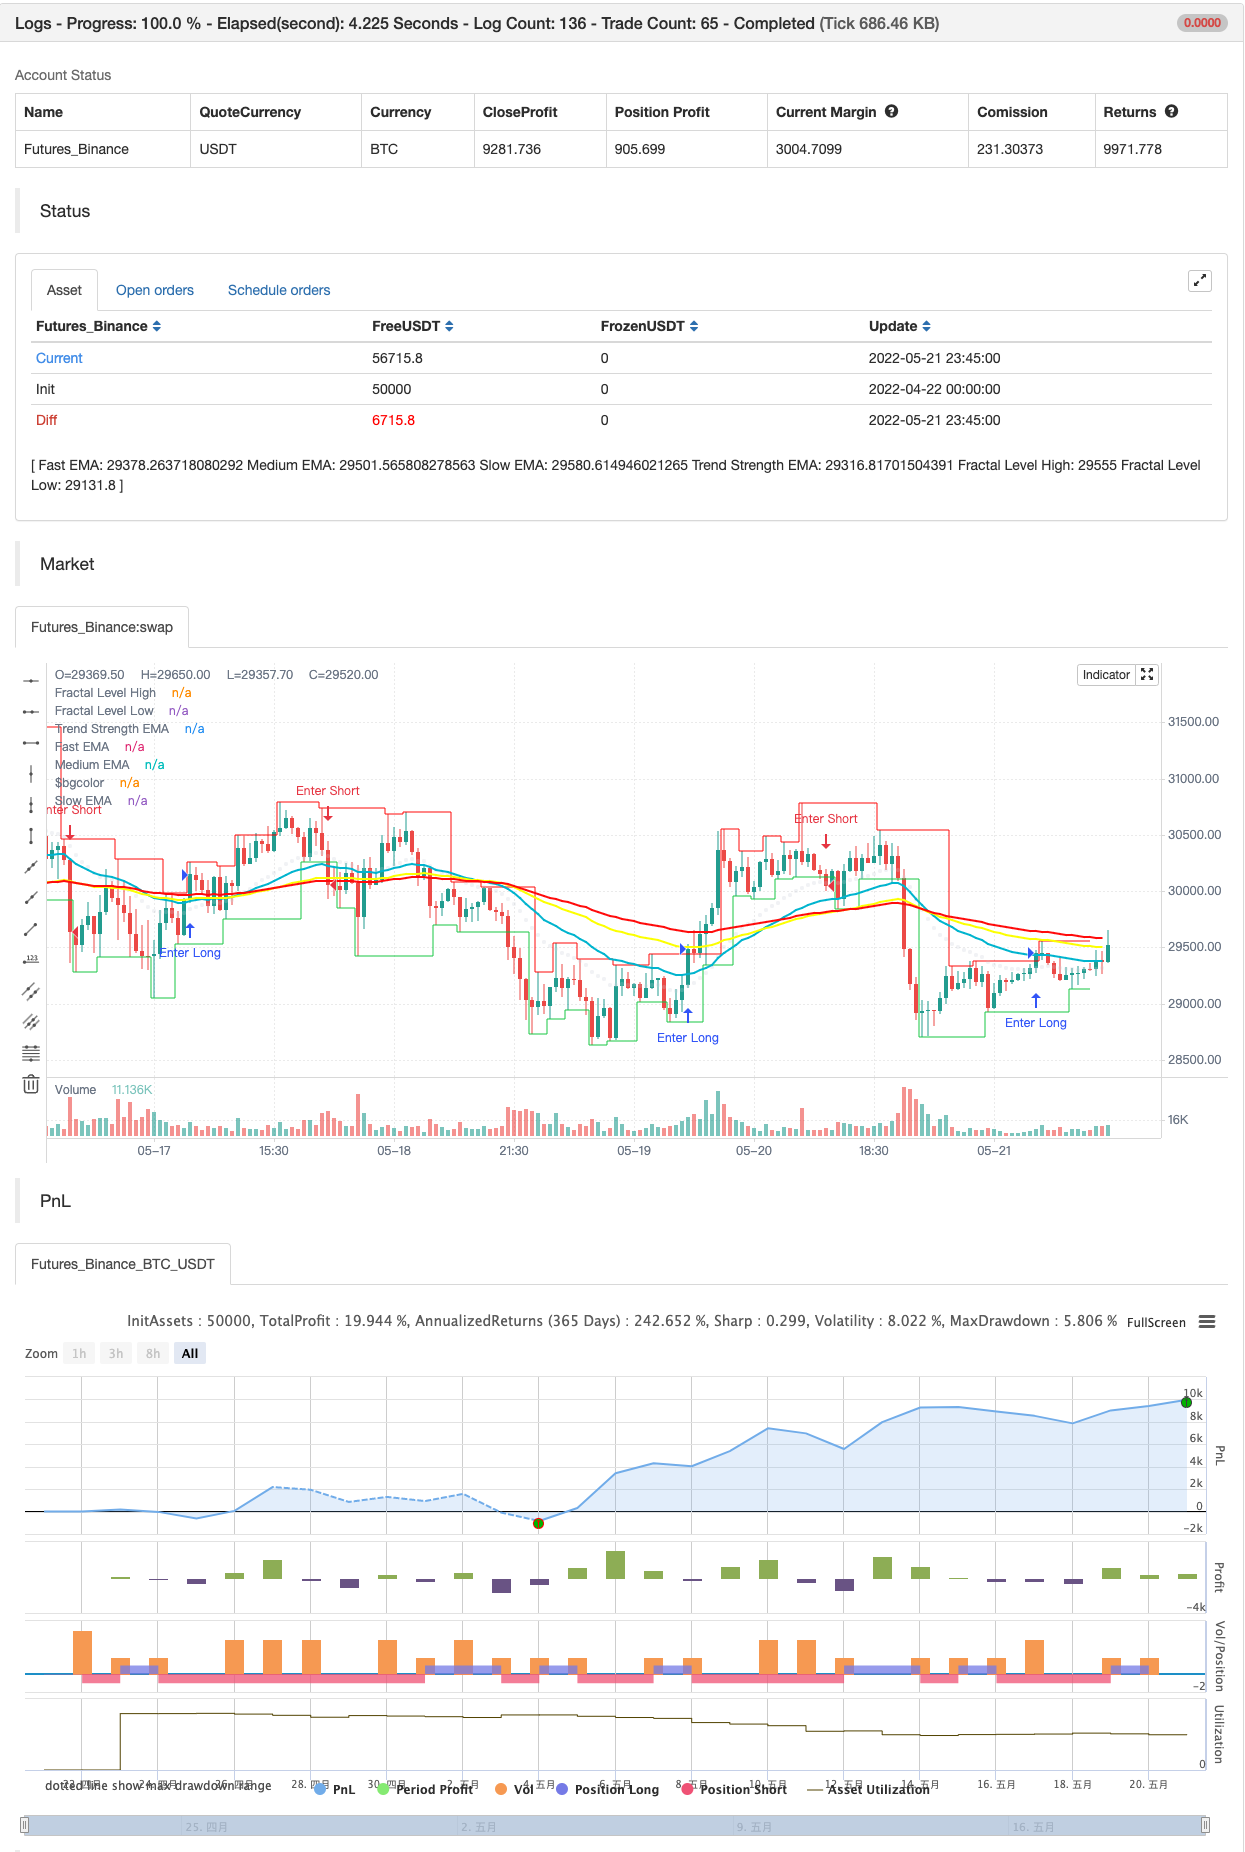
Il y a beaucoup d'indicateurs avec fractal et alligator de William. Comme beaucoup utilisent des EMA, il peut être utile de définir un ruban 3-EMA et de combiner des niveaux/boîtes fractal (remplissage de fond entre fractals supérieur et inférieur) pour le scalping de tendance. J'ai cherché ce type d'indicateur dans la communauté
Points clés:
Le ruban EMA est créé en utilisant 3 EMA
DISCLAIMER: Cet indicateur a été créé uniquement à des fins éducatives et ne constitue pas un conseil en matière d'investissement. Cet indicateur ne doit pas être utilisé comme un substitut à une étude de marché indépendante approfondie avant de prendre vos décisions commerciales réelles. Les données du marché ou tout autre contenu sont sujets à changement à tout moment sans préavis. La responsabilité pour toute perte ou dommage, y compris sans limitation toute perte de profit, qui peut résulter directement ou indirectement de l'utilisation de cet indicateur est la responsabilité de l'utilisateur qui l'utilise.
test de retour
/*backtest
start: 2022-04-22 00:00:00
end: 2022-05-21 23:59:00
period: 45m
basePeriod: 5m
exchanges: [{"eid":"Futures_Binance","currency":"BTC_USDT"}]
*/

//@version=5

indicator('[VDB]TrendScalp-FractalBox-3EMA', shorttitle='[VDB]TS-FB-3EMA', overlay=true, max_lines_count=500)

// By: ©vireshdb/vdb/vdb007
//
//Description:
//          There are many indicators with William’s Fractal and Alligator. As many use EMA’s it may be useful to define an EMA ribbon and
//          combining Fractal levels/box (filling background between top and bottom fractals) for trend scalping. I searched for this kind of indicator in community – some show fractals,
//          some just levels, some with alligator etc.but couldn't find the one needed. Hence thought of this indicator which may be of interest to other users too.
//Key Points:
//          EMA ribbon is created using3 EMA’s 35/70/105. Users can change these as per their preference. This is used for trend identification –
//              1. Bullish bias if Price > EMA1 > EMA2 > EMA3. 2. Bearish bias if Price < EMA1 < EMA2 < EMA3.
//          Background is marked during crossing of EMA1 and EMA2 to alert possible change in trend.
//          5-bar fractals are used to mark the Fractal levels and backgrounds between top and bottom fractals are filled to create the Fractal Box.
//          Fractal levels are marked with offset 2 only when the fractal formation is complete and hence are lagging.
//How to Use:
//          Sloping EMA ribbon is used for identifying the trend.
//          Trend strength ema is enabled. Angle of 30degree and above is strength
//          Fractal box break-out/ break-downs are used to trigger the trade with fractal high/low for entry/stoploss.
//              - Waiting for price contraction towards EMA ribbon resulting in smaller boxes is key to initiate trade.
//              - Avoid bigger boxes as SL’s will be big and price may move within.
//              - To draw the vertical lines of FractalBox change fractal level0 style to stepline.
//          This indicator -
//              - Combined with the cycle/ banded indicators such as CCI/Stochastic/RSI etc can make it a good trend scalping setup
//              - While trading in the direction of momentum in higher timeframe.
// Reference : This indicator was achieved by combing some fractal ideas from "Fractal Framer by brobear"
//
// Copyright 2022 vireshdb
//
// This program is free software: you can redistribute it and/or modify
// it under the terms of the GNU General Public License as published by
// the Free Software Foundation, either version 3 of the License, or
// any later version.
//
// This program is distributed in the hope that it will be useful,
// but WITHOUT ANY WARRANTY; without even the implied warranty of
// MERCHANTABILITY or FITNESS FOR A PARTICULAR PURPOSE.  See the
// GNU General Public License for more details.
//
// The GNU General Public License can be found here
// <http://www.gnu.org/licenses/>.
//
// Start of code *************************************************************************************************

showema = input.bool(true, title='Show EMA Ribbon')
fastema = input.int(35, title='Fast EMA', minval=1)
medema = input.int(70, title='Medium EMA', minval=1)
slowema = input.int(105, title='Slow EMA', minval=1)
trstrema = input.int(20, title='Trend Strength EMA', minval=1)
EMA1 = ta.ema(close, fastema)
EMA2 = ta.ema(close, medema)
EMA3 = ta.ema(close, slowema)
TSEMA = ta.ema(close, trstrema)

plot(showema and fastema ? EMA1 : na, title='Fast EMA', color=color.new(#00bcd4, 0), linewidth=2)
plot(showema and medema ? EMA2 : na, title='Medium EMA', color=color.new(#fcff00, 0), linewidth=2)
plot(showema and slowema ? EMA3 : na, title='Slow EMA', color=color.new(#ff0909, 0), linewidth=2)
plot(showema and trstrema ? TSEMA : na, title='Trend Strength EMA', color=color.new(#d1d4dc, 75), linewidth=1, style=plot.style_circles)

bgcolor(color=ta.crossover(EMA1, EMA2) ? color.new(color.lime, 90) : ta.crossunder(EMA1, EMA2) ? color.new(color.red, 90) : na, title='Trend Marker')

// FRACTAL Levels and Box *******************************************************************************************
PlotFractLevel = input(defval=true, title='Show Fractal Levels and Box')
lnwidth = input.int(defval=1, title='Fractal Line Width', minval=1, maxval=3)

//----- Main ---------------------
fractLevelHigh = float(na)
fractLevelLow = float(na)
fractHigh = bool(na)
fractLow = bool(na)
lag = 0
lag := 2
fractHigh := high[4] <= high[2] and high[3] <= high[2] and high[2] > high[1] and high[2] > high ? true : false
fractLow := low[4] >= low[2] and low[3] >= low[2] and low[2] < low[1] and low[2] < low ? true : false

// Fractal levels
fractLevelHigh := fractHigh ? nz(high[lag], high) : nz(fractLevelHigh[1], high)
fractLevelLow := fractLow ? nz(low[lag], low) : nz(fractLevelLow[1], low)

//---- Plotting Fractal levels ---------------------
p1 = plot(PlotFractLevel ? fractLevelHigh : na, title='Fractal Level High', color=color.new(#ff0909, 0), linewidth=lnwidth, offset=-lag, style=plot.style_stepline)
p2 = plot(PlotFractLevel ? fractLevelLow : na, title='Fractal Level Low', color=color.new(#1bce4e, 0), linewidth=lnwidth, offset=-lag, style=plot.style_stepline)
fill(p1, p2, title='Fill Fractal Box', color=fractLevelHigh >= fractLevelLow ? color.new(#d1d4dc,90) : color.new(#fff59d, 90))

// Alert conditions
alertcondition(close > nz(fractLevelHigh, high), title='Above Fractal Level High', message='Fractal High Breakout')
alertcondition(close < nz(fractLevelLow, low), title='Below Fractal Level Low', message='Fractal Low Breakdown')

// End of FRACTAL Levels and Box ****************************************************************************************
// End of code***********************************************************************************************************

if close > nz(fractLevelHigh, high)
    strategy.entry("Enter Long", strategy.long)
else if close < nz(fractLevelLow, low)
    strategy.entry("Enter Short", strategy.short)
- Stratégie de négociation basée sur les croisements consécutifs MACD or et mort
- Stratégie de négociation des bandes de Bollinger améliorées RSI
- Stratégie d'échange croisé à trois EMA
- Stratégie d'effet de levier croisé sur la moyenne mobile exponentielle
- Stratégie de moyenne mobile double GM-8 et ADX
- La stratégie de croisement renforcée de l'EMA avec le RSI/MACD/ATR
- La tendance du score Z suivant la stratégie
- L'entrée longue sur l'EMA croise avec la stratégie de gestion des risques
- Stratégie de négociation du VWAP
- La stratégie de WaveTrend Cross LazyBear
- Stratégie de négociation AlphaTradingBot
- La stratégie de recharge du MACD
- Les moyennes mobiles à tendance supérieure
- Échange ABC
- 15 minutes BTCUSDTPERP BOT
- L'entropie de Shannon V2
- Supertrend à l'arrière avec arrêt de traînée
- Flux de volume v3
- scalping horaire avec ma & rsi - ogcheckers
- ATR lissé
- Trouveur de blocs de commande
- Signaux QQE
- Filtre de l'amplitude de grille en U
- Indicateur MACD personnalisé CM - Cadre temporel multiple - V2
- Ligne de détection
- 2 Détection de la direction des couleurs moyennes mobiles
- L'outil R1 pour le scalping PullBack
- La stratégie d'achat et de vente dépend de AO+Stoch+RSI+ATR
- Le montant de l'aide est calculé en fonction de l'évolution de la situation.
- Ratio énergie directionnelle accélérée par volume RedK
- Pas de peinture.