Stratégie de retournement de fond sur plusieurs périodes

Aperçu
La stratégie utilise une combinaison de plusieurs indicateurs de forme sous-jacents pour identifier les moments de revers majeurs, adopter une stratégie de suivi de tendance et de stop loss, avec pour objectif de gagner plus que le stop loss.
Le principe
Cette stratégie est principalement basée sur les indicateurs suivants pour juger de l'inversion du fond:
-
La BottomSensivity de Noro: détermine si la ligne K présente une forme de fond spécifique.
-
L'indice de volonté de certitude (CVI): juger si la psychologie de la pluralité est en train de changer
-
L'indicateur ultime (UCS): détermine si la dérive est supérieure à la moyenne.
-
L'indicateur de rendement (RSI) est utilisé pour juger de la survente.
-
La combinaison de formes: une variété de formes de base, y compris des formes de croûte, des crochets, etc.
La stratégie utilise plusieurs combinaisons d'indicateurs sous-jacents, générant un signal d'achat lorsque le nombre de formes sous-jacentes définies par les paramètres de la stratégie est satisfait. Pour filtrer les fausses ruptures, la stratégie ajoute également le jugement de l'indicateur RSI, qui ne déclenche des achats que si elles sont survendues.
L'utilisateur peut personnaliser l'utilisation et les paramètres de chaque indicateur de jugement inférieur, ce qui permet une grande flexibilité. En même temps, la stratégie ajoute un filtre SMA linéaire pour éviter de faire trop en dessous de la tendance.
Les avantages
-
L'utilisation d'indicateurs multiples pour un jugement plus sûr
-
Paramètres d'indicateur personnalisables pour différentes variétés
-
Le filtrage SMA est linéaire et évite le recul.
-
L'accès à la ligne K rouge est configurable pour réduire les risques
-
Alerte à la fenêtre, surveillance en direct
Les risques
-
Les jugements combinés peuvent manquer le fond
-
Le bas n'est pas forcément en perpétuelle inversion
-
La question est de savoir si le volume des transactions peut soutenir la reprise.
Direction d'optimisation
-
Optimisation de la configuration des paramètres de l'indicateur et adaptation aux différentes variétés
-
Augmentation de la gestion des positions et réduction des coûts par l'augmentation des stocks
-
Augmenter les stratégies de stop loss et suivre les tendances de stop loss
Résumer
La stratégie exploite pleinement le jugement multi-indicateurs pour améliorer l'exactitude de l'identification des fonds de roulement, le suivi de la tendance pour bloquer les pertes et les gains, afin de contrôler efficacement les risques. Cependant, il faut toujours se demander si le volume des transactions peut soutenir la reprise de la tendance. Les utilisateurs peuvent optimiser les paramètres en fonction des caractéristiques de la variété pour s'adapter aux différents environnements du marché.
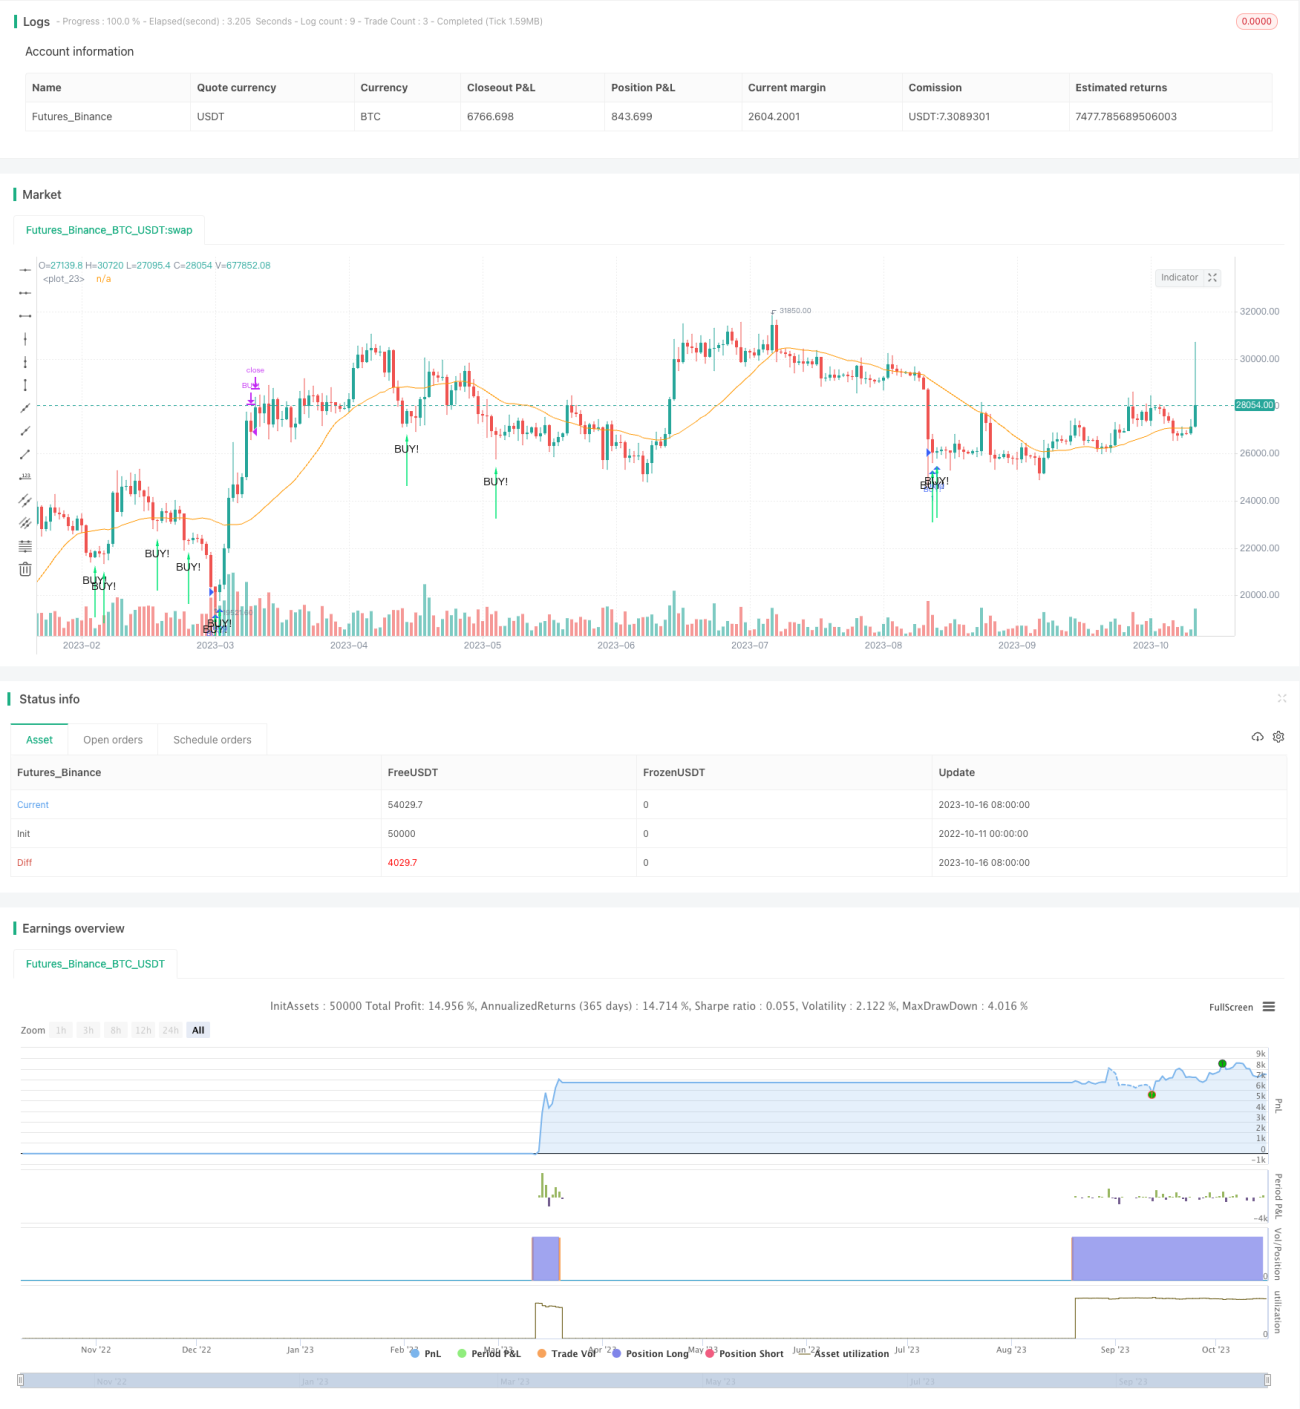
/*backtest
start: 2022-10-11 00:00:00
end: 2023-10-17 00:00:00
period: 1d
basePeriod: 1h
exchanges: [{"eid":"Futures_Binance","currency":"BTC_USDT"}]
*/

// the original indicator is Noro's BottomSensivity v0.6
//@version=4
strategy("Noro's BottomSensivity v0.6 strategy + rsi + Alarm", shorttitle="Bottom 0.6 StRsiAlarm", overlay=true)
- 1