Stratégie d'inversion multiple basée sur la moyenne de tendance

Aperçu
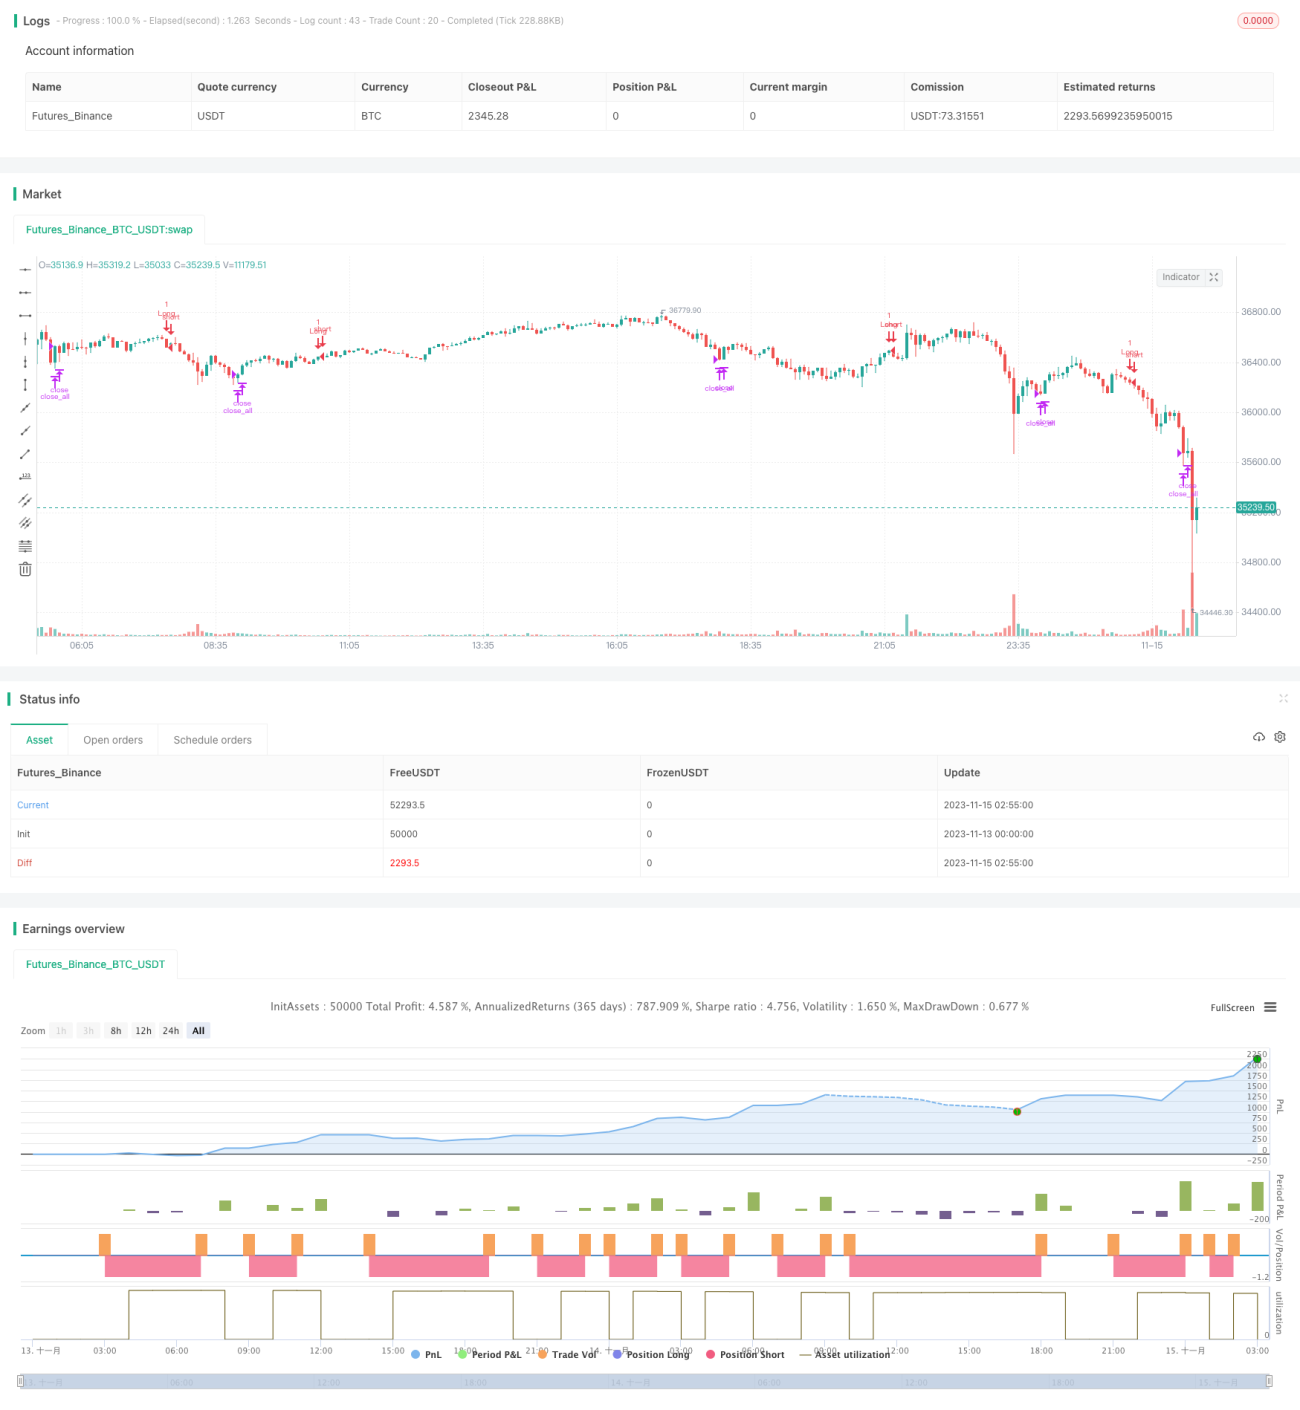
La stratégie calcule plusieurs indicateurs de tendance pour effectuer des opérations d'achat et de vente lorsque ceux-ci sont inversés. Les principaux indicateurs de tendance sont les indicateurs TDI, TCF, TTF et TII. La stratégie choisit dans sa configuration l'indicateur à utiliser pour générer un signal de négociation.
Principe de stratégie
-
Indicateur TDI
L'indicateur TDI est basé sur la dynamique de variation du prix. Il est construit par la technique de la somme et de l'assouplissement. Lorsque l'indicateur de direction TDI est en hausse sur la courbe TDI, il est en baisse.
-
Indicateur TCF
L'indicateur TCF calcule les variations positives et négatives du prix pour juger de la force des plus et des moins. Faites plus lorsque la force de la variation positive est supérieure à la force de la variation négative, sinon déposez.
-
Indicateur TTF
L'indicateur TTF juge la tendance en comparant la force des hauts et des bas. Le signal de surcharge est de passer 100 sur l'indicateur TTF et vice versa.
-
Indicateur TII
L'indicateur TII combine la moyenne et la fourchette de prix pour juger du renversement de tendance. Il prend en compte à la fois les tendances à court et à long terme.
Logique d'entrée dans une position de multi-paix Sélectionnez les signaux de trading appropriés en fonction des indicateurs de configuration.
Avantages stratégiques
La stratégie intègre plusieurs indicateurs de trading de tendance couramment utilisés et offre la flexibilité nécessaire pour s'adapter aux conditions du marché. Les avantages spécifiques sont:
- Les signaux de retournement de tendance permettent de saisir les opportunités de changement de tendance en temps opportun.
- Configurer différents indicateurs pour optimiser le ciblage
- Une riche combinaison d'indicateurs qui peuvent être utilisés en combinaison pour confirmer les signaux
Risque stratégique
Les principaux risques de cette stratégie sont les suivants:
- Les signaux de trading générés par les indicateurs de tendance peuvent être mal interprétés et entraîner des pertes
- Les indicateurs individuels ne permettent pas de juger de la tendance et sont vulnérables au bruit du marché.
- Une mauvaise configuration des paramètres de l'indicateur et des paramètres de transaction peut entraîner une mauvaise compréhension du marché et des transactions erronées.
Les mesures suivantes peuvent être prises pour réduire le risque:
- Optimiser les paramètres de l'indicateur pour trouver la meilleure combinaison de paramètres
- Combiner plusieurs signaux d'indicateurs pour effectuer des transactions et améliorer la qualité du signal
- Adaptation de la stratégie de gestion des positions et maîtrise des pertes individuelles
Orientation de l'optimisation de la stratégie
Cette stratégie peut être optimisée dans les domaines suivants:
- Test des combinaisons optimales d'indicateurs et de paramètres pour différents cycles de marché
- Ajoutez ou supprimez des indicateurs pour trouver la combinaison optimale
- Filtrer les signaux de transaction pour éliminer les signaux de désinformation
- Optimiser les stratégies de gestion des positions, telles que la modification des positions, le suivi des arrêts de perte, etc.
- Augmentation de l'indicateur de notation de l'apprentissage automatique pour aider à juger de la qualité du signal
Résumer
La stratégie combine les avantages de plusieurs indicateurs de renversement de tendance, optimisés par la configuration d'indicateurs et de paramètres, qui peuvent s'adapter à différents environnements de marché et opérer à des points de renversement de tendance. La clé est de trouver la combinaison optimale de paramètres et d'indicateurs tout en contrôlant les risques.
- 1