Stratégie de trading multi-périodes basée sur un indicateur de compression

Aperçu
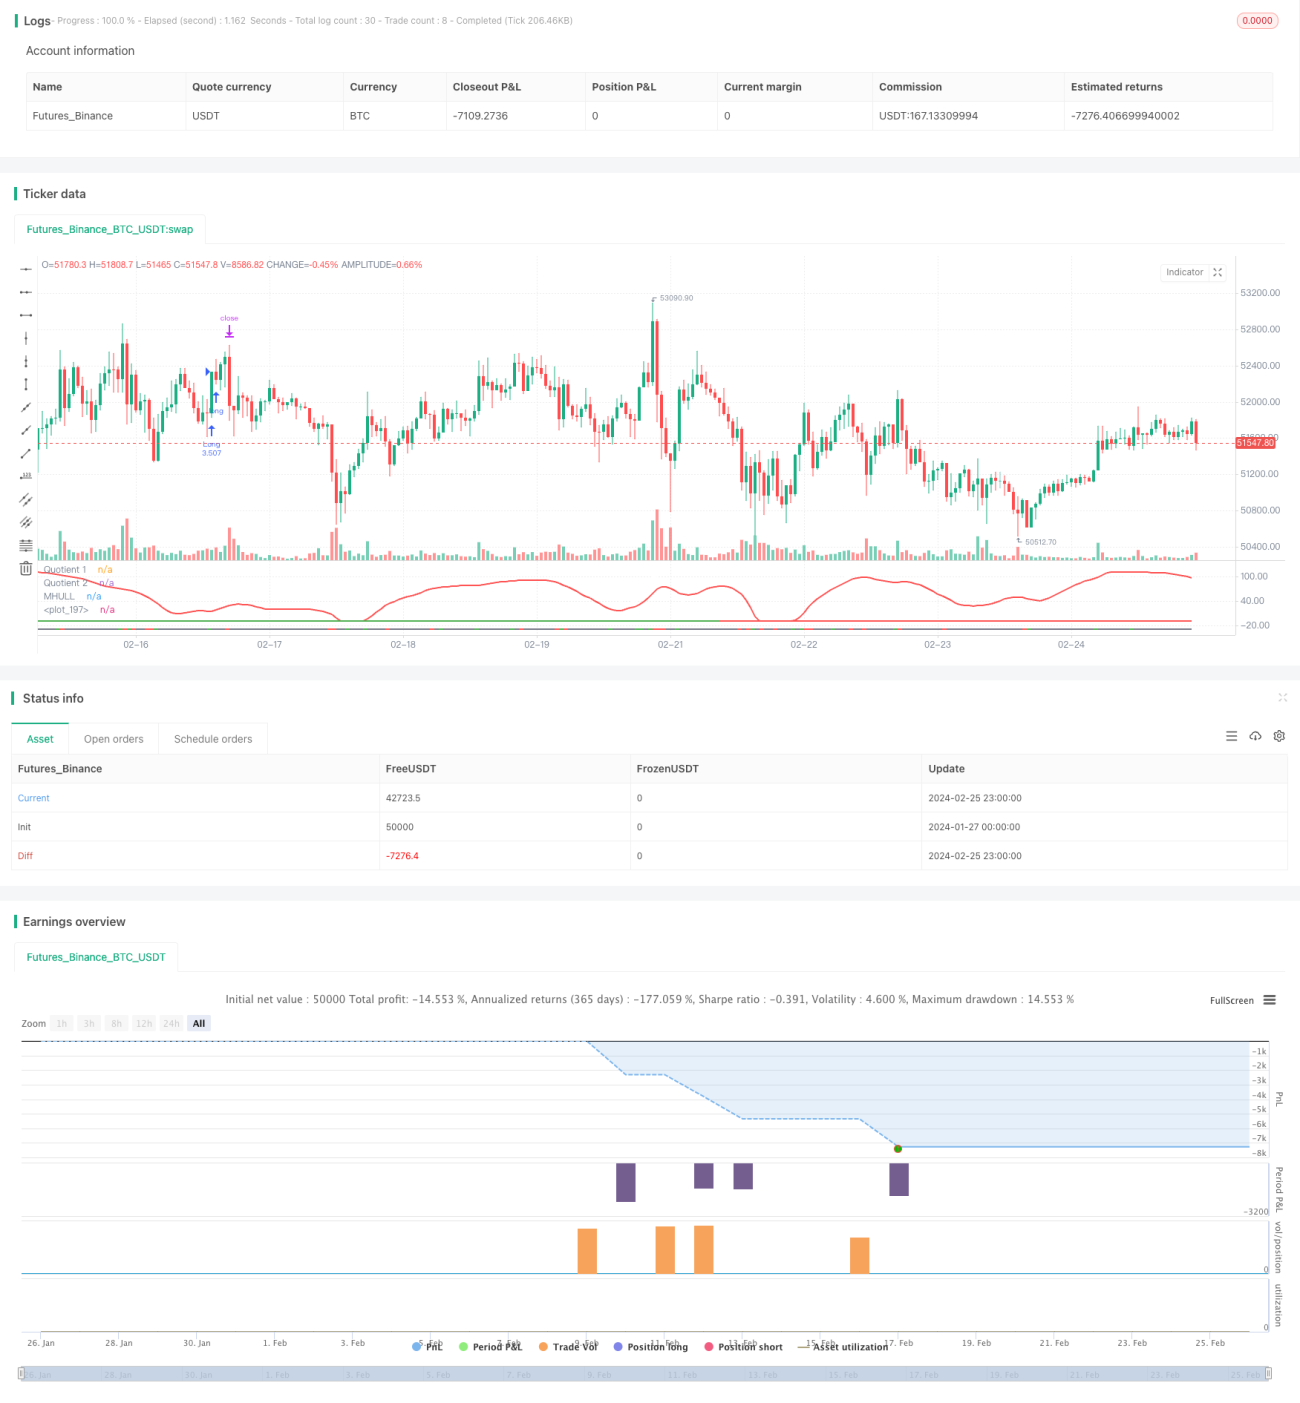
Cette stratégie permet de réaliser une stratégie quantitative de suivi de tendances et de transactions de rupture sur plusieurs périodes en combinant trois indicateurs: Boom Hunter, Hull Suite et Volatility Oscillator. La stratégie s'applique aux actifs numériques tels que Bitcoin qui présentent une forte volatilité et des prix soudains.
Le principe
La logique centrale de cette stratégie repose sur les trois indicateurs suivants:
-
Le chasseur de tissu: un oscillateur réalisé en utilisant la compression d'indicateurs, qui détermine les signaux d'achat et de vente par le croisement de deux indicateurs (Quotient1 et Quotient2).
-
Hull Suite (en anglais): un ensemble d'indicateurs de la moyenne mobile lisse, qui détermine la direction de la tendance par la relation entre la voie médiane et la voie ascendante et descendante
-
L'oscillateur de volatilitéL'indicateur est un oscillateur qui quantifie les fluctuations des prix.
La logique d'entrée de cette stratégie est que, lorsque les deux indices de Quotient du chasseur de tissu se croisent vers le haut ou vers le bas, le prix doit percer le milieu de l'orbite de Hull et s'écarter de la trajectoire supérieure ou inférieure, tandis que l'indicateur de volatilité est situé dans la zone de survente. Cela permet de filtrer certains faux signaux de rupture et d'améliorer la précision de l'entrée.
Le stop loss est défini par la recherche d'un creux ou d'un sommet de 20 lignes K par défaut pour une période donnée, tandis que le profit est obtenu en multipliant le pourcentage de stop loss par le pourcentage de stop loss de la configuration (par défaut 3 fois). Les positions sont calculées en fonction du pourcentage d'actifs totaux du compte (par défaut 3%) et de la marge de stop loss de l'indicateur spécifique.
Les avantages
- Utilisez la technique de l'indicateur de compression pour extraire les principaux signaux de transaction dans les prix et améliorer la probabilité de profit
- Vérification combinée de plusieurs indicateurs pour éviter les fausses ruptures et déterminer la direction de la tendance
- Mise en place d'un stop-loss dynamique permettant un suivi des tendances à risque maîtrisé
- Utilisation d'indicateurs de volatilité pour assurer la négociation dans un environnement à forte volatilité
- Analyser les délais multiples pour améliorer la stabilité stratégique
Les risques
- L'indicateur de chasseur de draps peut être déformé par compression, ce qui entraîne un signal erroné.
- Le système Hull sera en retard sur la voie et ne pourra pas suivre en temps réel les variations de prix.
- Une baisse de la volatilité peut entraîner une perte d'opportunités de négociation ou une liquidation à perte.
La solution est simple:
- Ajuster les paramètres de l'indicateur de compression, équilibrer la sensibilité de l'indicateur
- Essayez d'utiliser des moyennes mobiles avec des indices comme les EHMA au lieu d'indicateurs à mi-chemin.
- Ajout d'autres indicateurs de jugement pour éviter les fluctuations trompeuses
Optimisation
Cette stratégie peut être optimisée dans les domaines suivants:
-
Optimisation des paramètres: obtenir la meilleure combinaison de paramètres en modifiant les paramètres de l'indicateur tels que la longueur des cycles, le coefficient de compression, etc.
-
Optimisation du délaiTest de différentes périodes de temps (une minute, cinq minutes, trente minutes, etc.) pour trouver la période de négociation la plus appropriée
-
Optimisation de la position: modifier la taille et le ratio des positions pour chaque transaction afin de trouver le meilleur moyen d'utiliser les fonds
-
Optimisation des pertes: Ajustez votre position de stop loss en fonction des différentes transactions pour obtenir le meilleur rapport risque/rendement
-
Optimisation des conditions: Augmentation ou diminution des conditions de filtrage des indicateurs pour obtenir une heure d'entrée plus précise
Résumer
Cette stratégie, qui utilise une combinaison de trois indicateurs: le chasseur de tissu, la suite Hull et l'oscillateur de volatilité, permet de suivre la tendance des transactions sur plusieurs périodes et permet d'identifier efficacement les mouvements soudains des prix. Elle s'applique aux actifs numériques à forte volatilité.
- 1