विशिष्ट प्रवृत्ति अनुसरण रणनीति
अवलोकन
द्वि-समान रेखा क्रॉसिंग रणनीति एक विशिष्ट प्रवृत्ति ट्रैकिंग रणनीति है। यह दो अलग-अलग चक्रों के ईएमए औसत का उपयोग करती है, जो कीमतों की प्रवृत्ति के मोड़ को पकड़ने के लिए लंबी अवधि की औसत रेखा के नीचे लंबी अवधि की औसत रेखा के नीचे लंबी अवधि की औसत रेखा के नीचे और लंबी अवधि की औसत रेखा के नीचे होती है।
रणनीति सिद्धांत
इस रणनीति के लिए मुख्य संकेत दो ईएमए औसत रेखाएं हैं, 30 और 60 चक्रों के लिए क्रमशः। दो ईएमए औसत रेखाएं कोड में एक कस्टम फ़ंक्शन के माध्यम से गणना की जाती हैंः
emaLen1 = emaFuncOne(close, lenMA1)
emaLen2 = emaFuncTwo(close, lenMA2)
रणनीति के लिए ट्रेडिंग सिग्नल दो ईएमए समरेखाओं के क्रॉसिंग से आते हैंः
currentState = if emaLen2 > emaLen1
    0
else
    1

previousState = if emaLastLen2 > emaLastLen1
    0
else
    1

convergence = if currentState != previousState
    1
else
    0
जब अल्पकालिक ईएमए पर दीर्घकालिक ईएमए पहनते हैं, तो वर्तमान राज्य पिछले राज्य के बराबर नहीं होता है, एक क्रॉस सिग्नल दिखाई देता है। इस समय अधिक करें। जब एक अल्पकालिक ईएमए एक दीर्घकालिक ईएमए के नीचे से गुजरता है, तो वर्तमान राज्य पिछले राज्य के बराबर नहीं होता है, एक क्रॉस सिग्नल दिखाई देता है। इस समय खाली कर दिया गया है।
श्रेष्ठता विश्लेषण
इस रणनीति के निम्नलिखित फायदे हैं:
- रणनीति सरल, सहज, समझने और लागू करने में आसान है
- ईएमए की चिकनी सुविधाओं का उपयोग करके बाजार के शोर को प्रभावी ढंग से फ़िल्टर करें
- स्वचालित ट्रेंड ट्रैकिंग, कोई भी खरीद या बिक्री नहीं कर सकता
जोखिम विश्लेषण
इस रणनीति के कुछ जोखिम भी हैं:
- द्वि-समान-रेखा क्रॉसिंग सिग्नल में देरी हो सकती है, समय पर मोड़ को पकड़ने में असमर्थ
- भूकंप के दौरान कई बार गलत सिग्नल आ सकते हैं
- अनुचित पैरामीटर सेट करने से अतिसंवेदनशील या अतिविलंब हो सकता है
ईएमए चक्र को समायोजित करके या फ़िल्टरिंग शर्तों को जोड़कर अनुकूलित किया जा सकता है।
अनुकूलन दिशा
इस रणनीति को निम्नलिखित पहलुओं से अनुकूलित किया जा सकता हैः
- विभिन्न लंबाई के ईएमए चक्र संयोजन का परीक्षण करना
- बढ़ी हुई लेनदेन या अस्थिरता स्थिति फ़िल्टर झूठे संकेत
- अन्य संकेतकों के साथ प्रवृत्ति की पुष्टि, जैसे MACD
- स्टॉप लॉस स्टॉप सेट करें
संक्षेप
द्वि-समान रेखा क्रॉसिंग रणनीति एक सरल और व्यावहारिक प्रवृत्ति ट्रैकिंग रणनीति है। यह सीधे-आगे है, इसे लागू करना आसान है, और यह स्वचालित रूप से ट्रेंड को ट्रैक कर सकता है। लेकिन इसमें कुछ देरी और झूठे संकेतों का जोखिम भी है। पैरामीटर अनुकूलन और फ़िल्टरिंग शर्तों को जोड़ने के माध्यम से इसे और बेहतर बनाया जा सकता है, जिससे यह मात्रात्मक व्यापार की बुनियादी रणनीतियों में से एक बन जाता है।
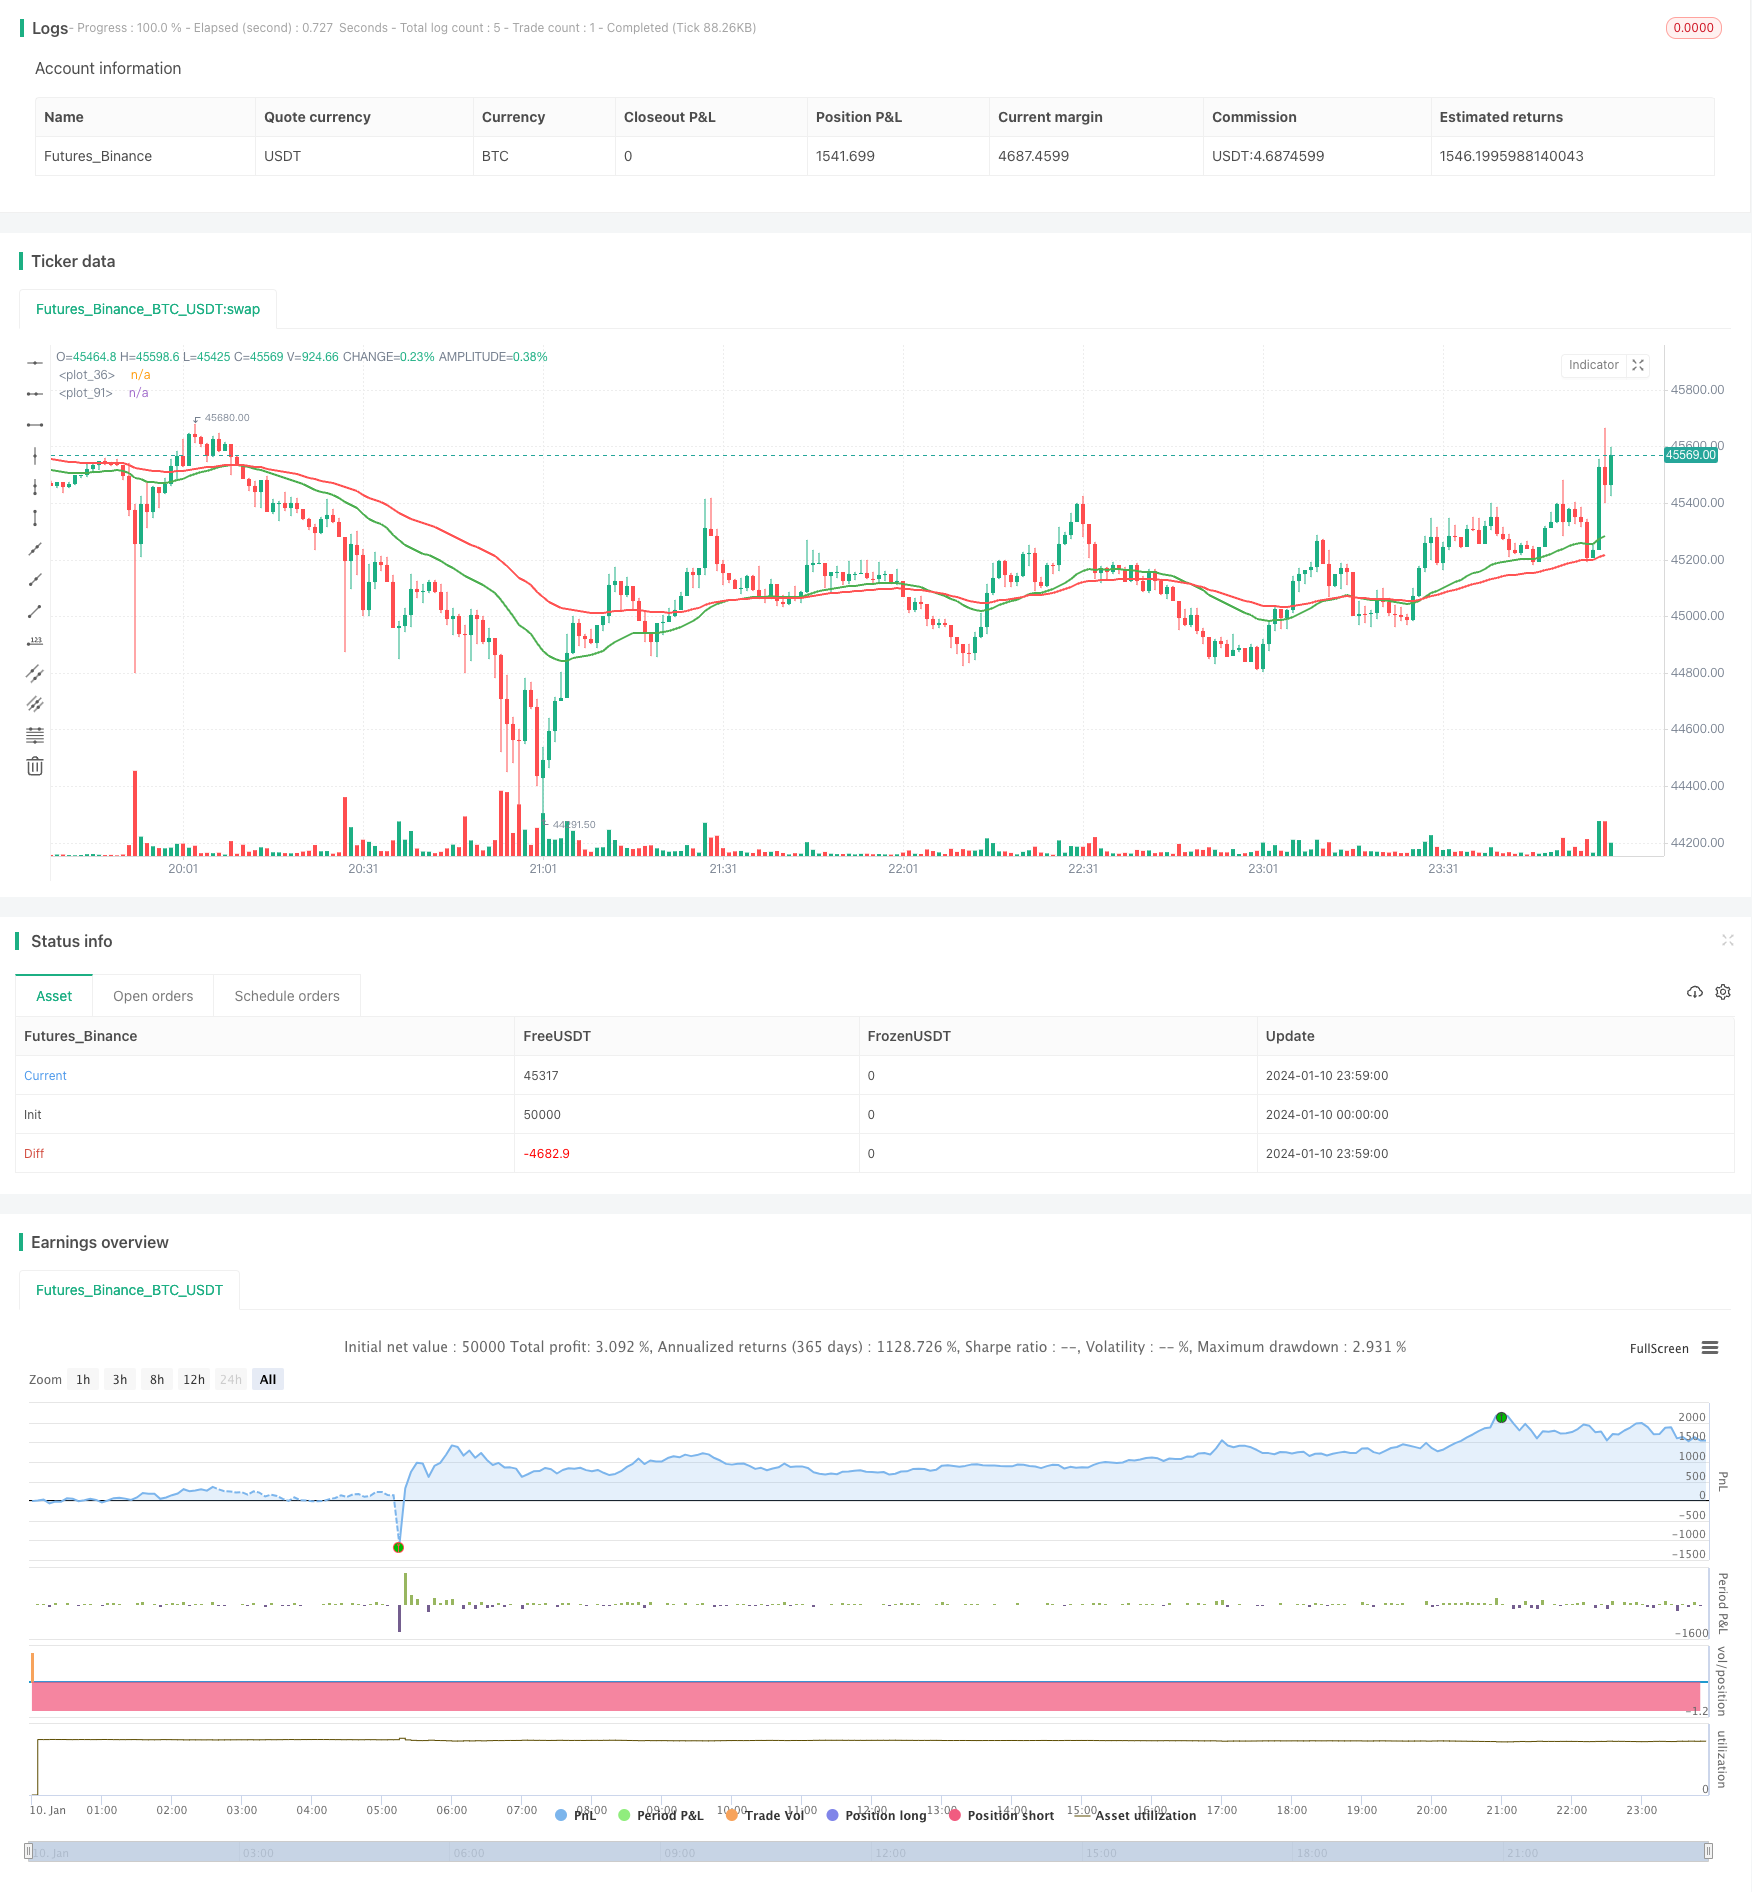
/*backtest
start: 2024-01-10 00:00:00
end: 2024-01-11 00:00:00
period: 1m
basePeriod: 1m
exchanges: [{"eid":"Futures_Binance","currency":"BTC_USDT"}]
*/

//@version=2
strategy("ParkerMAStrat", overlay=true)

lenMA1=input(title="Length 1", defval=30)
lenMA2=input(title="Length 2",  defval=60)

x = 0

checkLines(current, last) =>

    if current > last
        x = 1
    else
        x = 0
    x


//plot ema based on len1
emaFuncOne(src, time_period) =>

    alpha = 2 / (time_period + 1)
    // we have defined the alpha function above
    ema = 0.0
    // this is the initial declaration of ema, since we dont know the first ema we will declare it to 0.0 [as a decimal]
    ema := alpha * src + (1 - alpha) * nz(ema[1])
    // this returns the computed ema at the current time
    // notice the use of : (colon) symbol before =, it symbolises, that we are changing the value of ema,
    // since the ema was previously declared to 0
    // this is called mutable variale declaration in pine script
    ema
    // return ema from the function

emaLen1 = emaFuncOne(close, lenMA1)


plot(emaLen1, color=green, transp=0, linewidth=2)
// now we plot the _10_period_ema

//plot ema based on len2
emaFuncTwo(src, time_period) =>

    alpha = 2 / (time_period + 1)
    // we have defined the alpha function above
    ema = 0.0
    // this is the initial declaration of ema, since we dont know the first ema we will declare it to 0.0 [as a decimal]
    ema := alpha * src + (1 - alpha) * nz(ema[1])
    // this returns the computed ema at the current time
    // notice the use of : (colon) symbol before =, it symbolises, that we are changing the value of ema,
    // since the ema was previously declared to 0
    // this is called mutable variale declaration in pine script
    ema
    // return ema from the function

//plot ema based on len2
emaFuncOneLast(src, time_period) =>

    alpha = 2 / (time_period + 1)
    // we have defined the alpha function above
    ema = 0.0
    // this is the initial declaration of ema, since we dont know the first ema we will declare it to 0.0 [as a decimal]
    ema := alpha * src + (1 - alpha) * nz(ema[0])
    // this returns the computed ema at the current time
    // notice the use of : (colon) symbol before =, it symbolises, that we are changing the value of ema,
    // since the ema was previously declared to 0
    // this is called mutable variale declaration in pine script
    ema
    // return ema from the function

//plot ema based on len2
emaFuncTwoLast(src, time_period) =>

    alpha = 2 / (time_period + 1)
    // we have defined the alpha function above
    ema = 0.0
    // this is the initial declaration of ema, since we dont know the first ema we will declare it to 0.0 [as a decimal]
    ema := alpha * src + (1 - alpha) * nz(ema[0])
    // this returns the computed ema at the current time
    // notice the use of : (colon) symbol before =, it symbolises, that we are changing the value of ema,
    // since the ema was previously declared to 0
    // this is called mutable variale declaration in pine script
    ema
    // return ema from the function


emaLastLen1 = emaFuncOneLast(close, lenMA1)
emaLastLen2 = emaFuncTwoLast(close, lenMA2)
emaLen2 = emaFuncTwo(close, lenMA2)


plot(emaLen2, color=red, transp=30, linewidth=2)
// now we plot the _10_period_ema

//now we compare the two and when green crosses red we buy/sell (line1 vs line2)

previousState = if emaLastLen2 > emaLastLen1
    0
else
    1

currentState = if emaLen2 > emaLen1
    0
else
    1

convergence = if currentState != previousState
    1
else
    0


lineCheck = if convergence == 1
    checkLines(currentState, previousState)

if lineCheck == 1
    strategy.entry("Long", strategy.long)
else
    strategy.entry("Short", strategy.short)