Strategi penyeberangan rata-rata bergerak

Ringkasan
Strategi ini menggunakan berbagai indikator teknis seperti moving averages, oscillators, dan lain-lain, yang dikombinasikan dengan crossover rata-rata, untuk mengidentifikasi tren harga saham dan titik balik di bawah dan di atas, untuk melakukan operasi jual beli.
Prinsip
Strategi ini terdiri dari beberapa bagian utama:
-
Tentukan interval: Tentukan jumlah menit pada interval waktu dari peta K, seperti 1 menit, 5 menit, dan sebagainya.
-
Pilih Moving Average: Mengkonfigurasi parameter EMA, SMA, dan lain-lain yang biasa digunakan, seperti 10th line, 20th line, dll.
-
Pilih indikator getaran: Konfigurasi parameter indikator getaran seperti RSI, MACD, William.
-
Menghitung sinyal beli dan jual: Menghitung nilai rata-rata bergerak dan indikator osilasi dengan fungsi yang disesuaikan. Sinyal beli dihasilkan ketika rata-rata jangka pendek melintasi rata-rata jangka panjang; Sinyal jual dihasilkan ketika rata-rata jangka pendek melintasi rata-rata jangka panjang.
-
Sistem peringkat: Skor numerik dari sinyal beli dan jual dari masing-masing indikator, kemudian rata-rata, mendapatkan indeks peringkat keseluruhan. Indeks peringkat lebih besar dari 0 untuk sinyal beli, lebih kecil dari 0 untuk sinyal jual.
-
Sinyal perdagangan: menghasilkan sinyal perdagangan akhir berdasarkan indeks peringkat yang lebih besar atau lebih kecil dari 0, untuk melakukan operasi beli atau jual.
Strategi ini menggunakan berbagai indikator dalam kombinasi yang dapat secara efektif mengidentifikasi tren harga dan titik balik, meningkatkan keandalan sinyal. Persegi rata adalah sinyal teknis tren yang efektif, yang dikombinasikan dengan indikator getaran membantu menghindari terobosan palsu. Sistem peringkat juga membuat sinyal perdagangan lebih jelas.
Keunggulan
- Kombinasi crossover dan berbagai indikator getaran, sinyal perdagangan lebih dapat diandalkan dan menghindari sinyal palsu
- Sistem penilaian membuat sinyal jual beli lebih jelas
- Pemrograman modular menggunakan fungsi khusus, struktur kode yang jelas
- Menggunakan berbagai periode waktu untuk analisis kombinasi, meningkatkan akurasi
- Pengaturan parameter yang dioptimalkan, seperti panjang RSI, MACD periode rata-rata cepat dan lambat
- Fleksibilitas ditingkatkan dengan parameter yang dapat disesuaikan dengan indikator dan parameter garis rata-rata
Risiko yang ada
- Performa saham di bursa besar berbeda-beda
- Frekuensi transaksi mungkin lebih tinggi, meningkatkan biaya transaksi dan risiko slippage
- Parameter optimasi perlu diuji berulang kali untuk menyesuaikan dengan karakteristik saham yang berbeda
- Ada beberapa risiko penarikan dan kerugian
Risiko dapat dikurangi dengan melakukan hal-hal berikut:
- Pemilihan saham berdasarkan pergerakan pasar besar
- Adaptasi jangka waktu yang tepat untuk mengurangi frekuensi transaksi
- Pengaturan parameter yang dioptimalkan agar lebih sesuai dengan karakteristik saham
- Menggunakan strategi stop loss untuk mengendalikan kerugian
Arah optimasi
Strategi ini dapat dioptimalkan lebih lanjut dalam beberapa hal:
- Menambahkan lebih banyak indikator, seperti indikator volatilitas, sinyal penguatan
- Parameter pengoptimalan otomatis dengan metode pembelajaran mesin
- Menambahkan modul pilihan saham dan industri
- Kombinasi metode seleksi saham kuantitatif
- Adaptasi dan penghentian
- Pertimbangkan kondisi pasar dan hindari situasi yang tidak pasti
- Analisis hasil transaksi real-time, penyesuaian berat skor
Secara keseluruhan, strategi ini mengintegrasikan breakout rata-rata dan berbagai indikator untuk mengidentifikasi pergerakan harga secara efektif. Namun, perlu terus menguji optimasi, mengendalikan risiko. Di masa depan, dapat dilakukan perbaikan dari portofolio pilihan saham, optimasi parameter, dan stop loss.
Meringkaskan
Strategi ini menggunakan crossover rata-rata sebagai sinyal perdagangan utama, didukung oleh berbagai indikator getaran, dan menggunakan sistem penilaian untuk menghasilkan sinyal jual beli yang jelas. Dapat secara efektif mengidentifikasi tren harga dan titik balik, tetapi perlu mengendalikan frekuensi perdagangan, mengurangi biaya dan risiko perdagangan, dan juga perlu terus mengoptimalkan parameter.
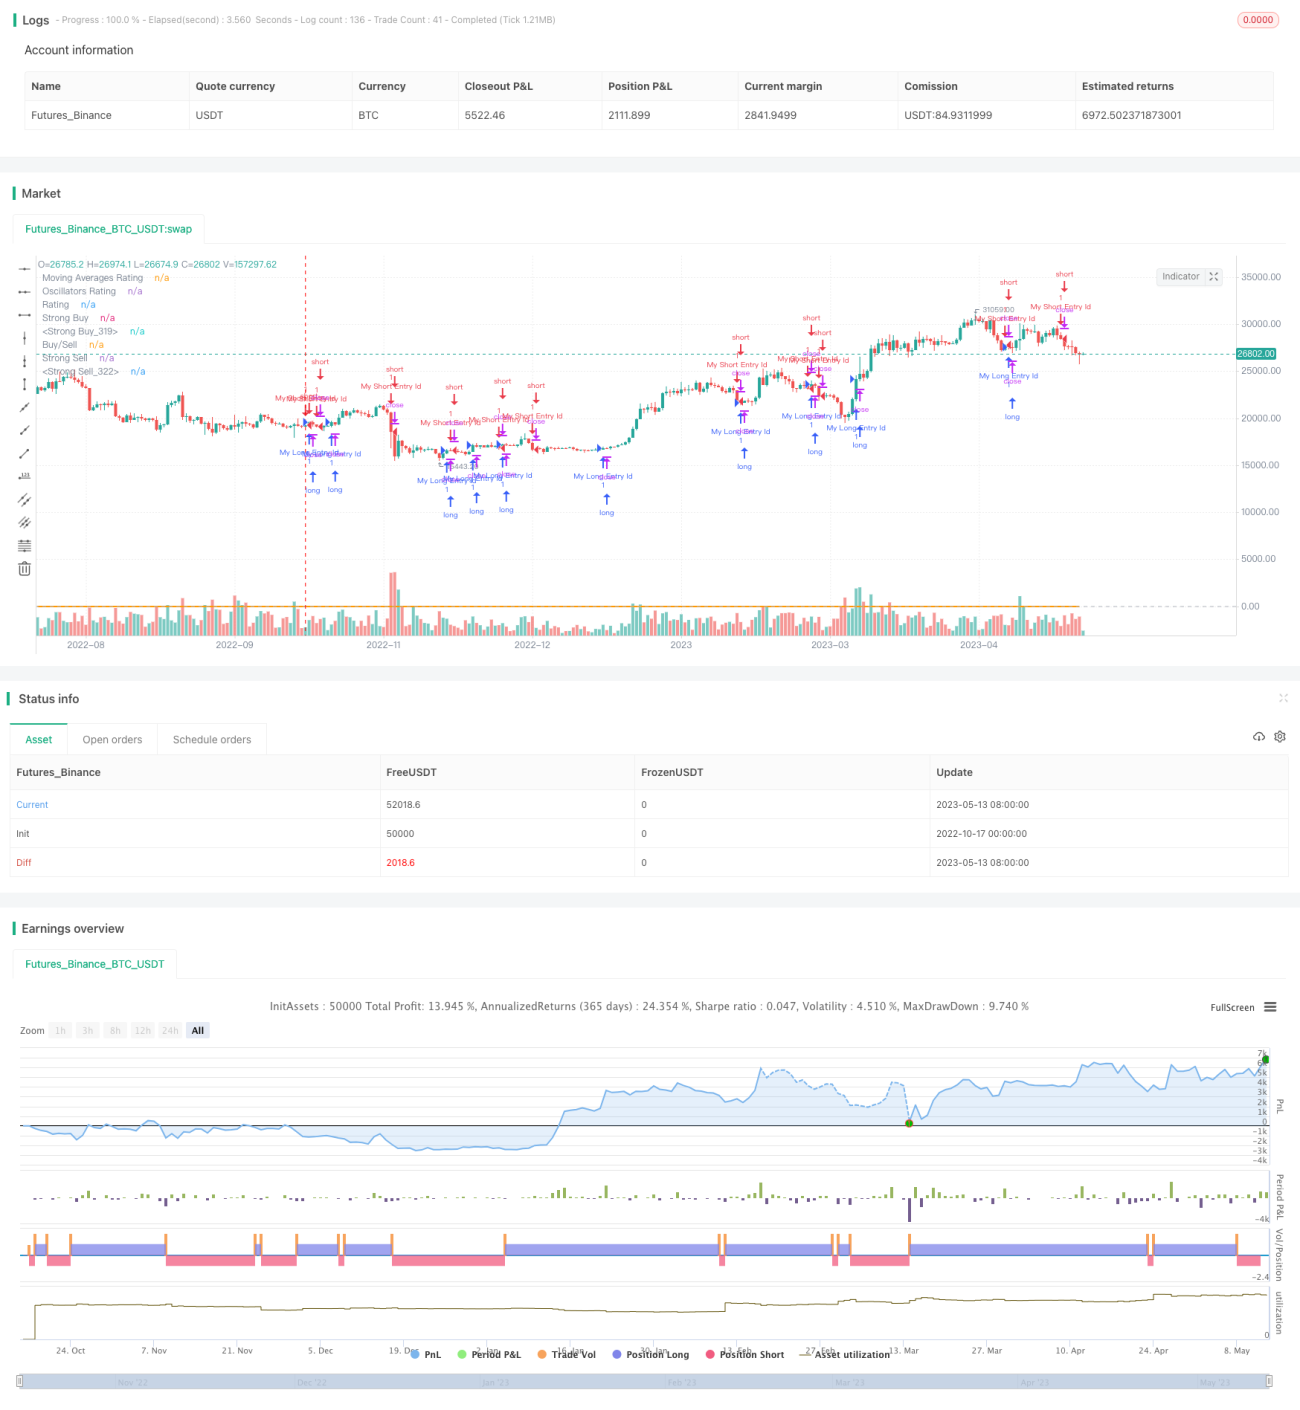
/*backtest
start: 2022-10-17 00:00:00
end: 2023-05-14 00:00:00
period: 1d
basePeriod: 1h
exchanges: [{"eid":"Futures_Binance","currency":"BTC_USDT"}]
*/

//@version=4
strategy("TV Signal", overlay=true, initial_capital = 500, currency = "USD")

// -------------------------------------- GLOBAL SELECTION --------------------------------------------- //- 1