Strategi terobosan rata-rata pergerakan tingkat tinggi

Ringkasan
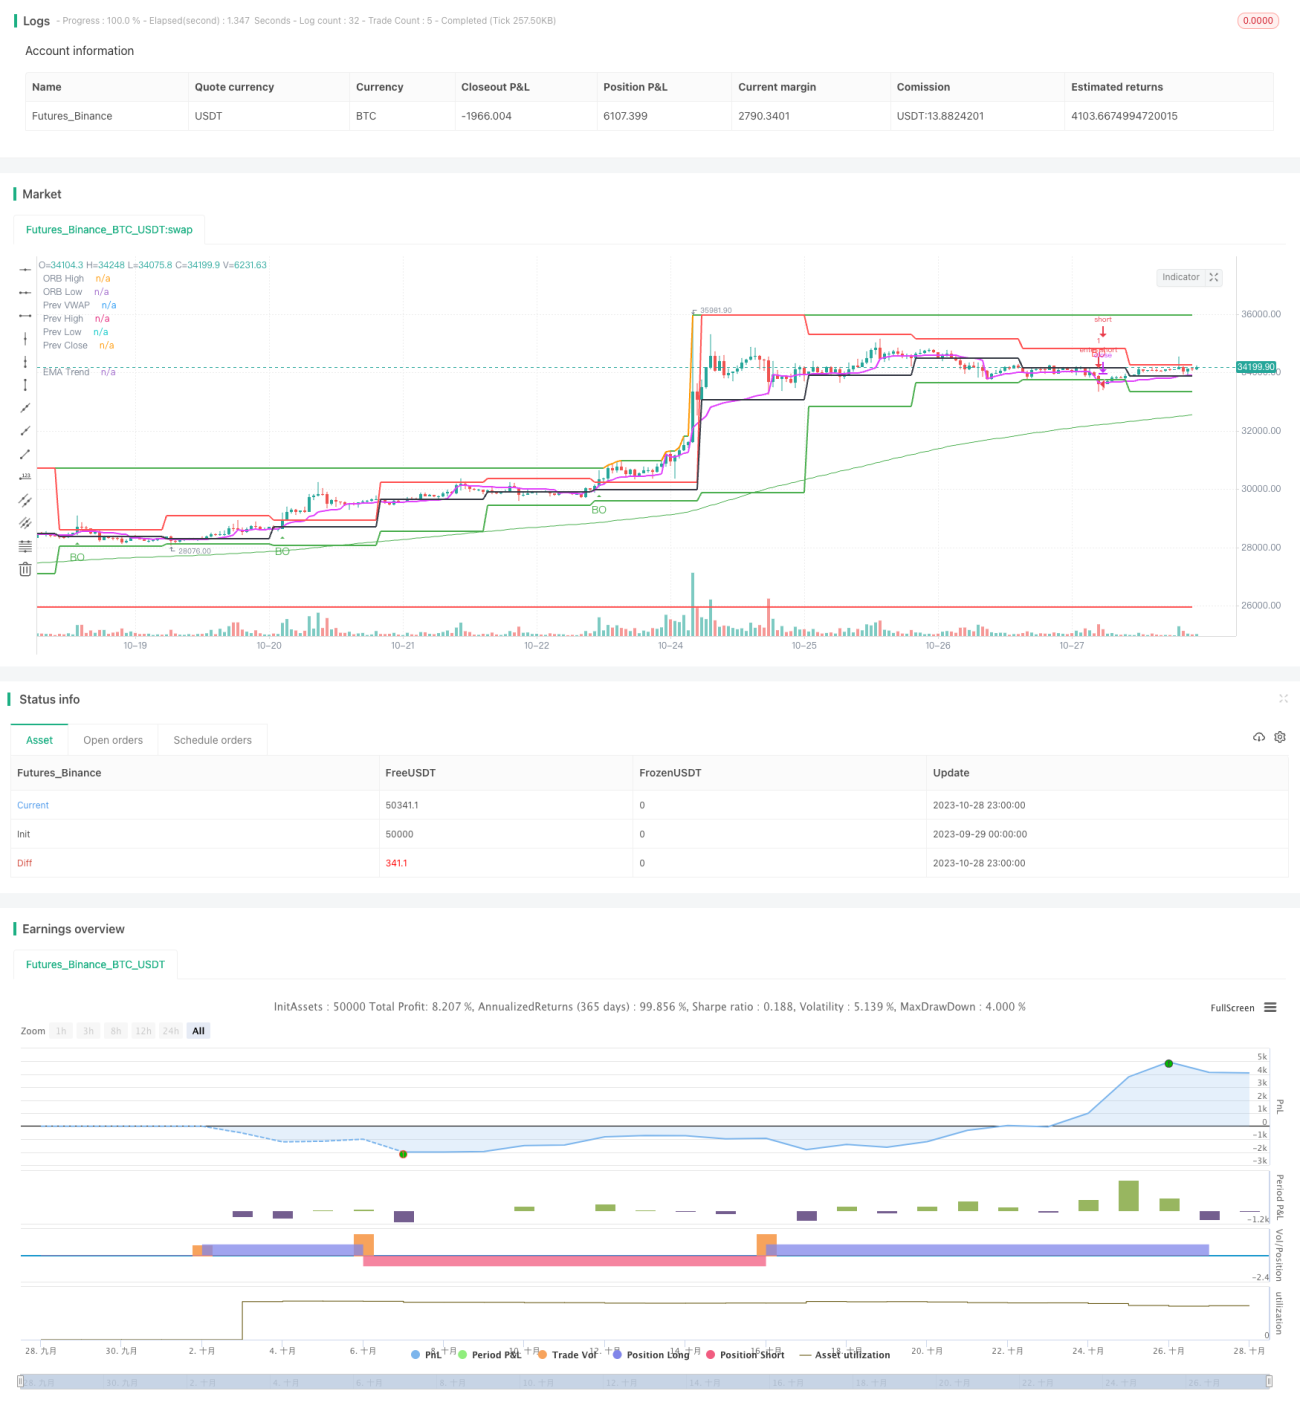
Gagasan utama dari strategi ini adalah untuk melakukan perdagangan tren dengan menggunakan breakout pada level tinggi. Dalam jangka waktu level tinggi, ketika harga menembus ke atas atau ke bawah garis rata-rata, awal tren dapat diidentifikasi, dan arah yang tepat dapat dipilih untuk diikuti.
Prinsip Strategi
Strategi ini dikembangkan melalui bahasa Pine Script dan terdiri dari beberapa bagian utama:
-
Masukkan parameter
Periode rata-rata periode didefinisikan dengan default 200; K-linear timeframe didefinisikan dengan default "D".
-
Perhitungan rata-rata
Fungsi ta.ema digunakan untuk menghitung rata-rata bergerak eksponensial.
-
Keputusan yang Menantang
Fungsi ta.crossover dan ta.crossunder digunakan untuk menentukan apakah harga menembus atau menembus garis rata-rata.
-
Peta sinyal
Saat terjadi penembusan, gambarkan panah ke atas atau ke bawah pada garis K.
-
Perdagangan posisi terbuka
Pilih posisi yang terbuka saat terjadi terobosan, dan tutup posisi setelah mencapai jarak stop loss ganda.
Strategi ini bergantung pada kemampuan untuk menilai tren pada tingkat tinggi, dan mengikuti tren melalui operasi yang sederhana. Strategi ini lebih tradisional.
Analisis Keunggulan
Strategi ini memiliki beberapa keuntungan:
-
Konsepnya sederhana, mudah dipahami dan dikuasai.
-
Dengan hanya mengandalkan satu indikator rata-rata, pengaturan parameter sederhana.
-
Operasi penembusan mudah tren, tidak sering diperdagangkan.
-
Siklus tingkat tinggi menunjukkan tren besar dengan jelas dan tidak mudah dipengaruhi oleh fluktuasi jangka pendek.
-
Kombinasi siklus waktu yang berbeda dapat dikonfigurasi untuk menyesuaikan dengan varietas yang berbeda.
-
Di Indonesia, ada banyak jenis hewan yang bisa dipanen, namun tidak semua bisa dipanen secara bersamaan.
Analisis risiko
Strategi ini juga memiliki beberapa risiko:
-
Sinyal-sinyal penembusan dapat menyebabkan terjadinya penembusan palsu yang tidak efektif untuk menyaring pergerakan pasar.
-
Tidak dapat memanfaatkan peluang yang tersedia secara efektif.
-
Jika Anda salah perhitungan, kerugian bisa lebih besar.
-
Periode rata-rata dan siklus perdagangan yang tidak cocok dapat menyebabkan overtrading atau kerugian.
-
Tidak bisa menghentikan kerugian secara real time, kemungkinan besar kerugian akan bertambah.
Solusi untuk menanggapi risiko meliputi: kombinasi indikator tren, peningkatan kondisi filter, pengurangan periode kepemilikan posisi yang tepat, penyesuaian posisi stop loss secara dinamis, dll.
Arah optimasi
Strategi ini dapat dipertimbangkan untuk dioptimalkan dari beberapa aspek berikut:
-
Menambahkan kombinasi indikator tren seperti MACD, KD, dan lain-lain untuk meningkatkan keandalan terobosan.
-
Meningkatkan kondisi penyaringan seperti volume transaksi atau saluran Brinline untuk menghindari terjadinya penembusan palsu.
-
Optimalkan pencocokan periode parameter agar periode pegangan lebih sesuai dengan periode tren.
-
Menambahkan strategi stop loss secara real-time untuk mengendalikan kerugian tunggal dengan melacak stop loss.
-
Pertimbangkan untuk mengoptimalkan parameter secara dinamis dengan teknologi pembelajaran mesin.
-
Mencoba berbagai portofolio aset untuk meningkatkan stabilitas secara keseluruhan.
Meringkaskan
Strategi ini secara keseluruhan relatif sederhana dan praktis, untuk mencapai pelacakan tren melalui keseragaman yang sederhana, mudah dikuasai, dan dapat digunakan sebagai salah satu strategi masuk untuk perdagangan kuantitatif. Namun, ada beberapa masalah yang perlu diperbaiki melalui indikator kombinasi, parameter optimasi, dan stop loss dinamis, sehingga strategi lebih stabil dan efisien.
- 1