Strategi Perdagangan Kuantitatif Triple Super Trend

1
Follow
1779
Followers
Ringkasan
Strategi perdagangan kuantitatif triple overtrend adalah strategi perdagangan short-line yang menggabungkan tiga indikator overtrend. Strategi ini cocok untuk perdagangan intraday dan short-line arbitrage di pasar perdagangan frekuensi tinggi seperti cryptocurrency, forex, dan lainnya.
Prinsip Strategi
- Menggunakan 200 hari moving average untuk menentukan arah tren pasar secara keseluruhan. Harga melakukan lebih ketika naik, harga melakukan lebih ketika turun.
- Menggunakan tiga indikator supertrend untuk menentukan arah tren pasar segmen. Indikator supertrend dapat secara akurat menentukan tren overhead di pasar segmen.
- Sinyal masuk dibangun dengan indikator Stoch RSI yang menilai overbought dan oversold dengan menggunakan Brinks. Sinyal masuk dibangun dengan indikator Stoch RSI yang dapat mengidentifikasi peluang reversal.
- Berdasarkan stop loss overtrend, stop stop overtrend menentukan rasio risiko-pengembalian sebesar 1,5 kali lipat.
Keunggulan Strategis
- Validasi indikator tren ganda, meningkatkan akurasi pengambilan keputusan.
- Indikator overbought dan oversold mengidentifikasi peluang untuk reversal dan mengambil inisiatif untuk reversal.
- Stop loss adalah mekanisme pengendalian risiko-keuntungan.
- Ada banyak ruang untuk mendapatkan keuntungan dari perdagangan frekuensi tinggi.
Risiko Strategis
- Pada saat siklus besar tidak menguntungkan, risiko kerugian dalam perdagangan short line lebih besar.
- Kemungkinan kegagalan dalam proses pembalikan masih ada, yang dapat menyebabkan keputusan yang salah.
- Perlu sering dipasarkan, tidak cocok untuk perdagangan di luar lapangan.
Optimasi Strategi
- Optimalkan parameter moving average untuk periode yang lebih panjang.
- Optimalkan parameter Stoch RSI untuk mengurangi tingkat sinyal yang salah.
- Optimalkan parameter siklus ATR overtrend untuk meningkatkan efek stop loss.
- Meningkatkan manajemen posisi, meningkatkan posisi sesuai dengan tingkat penarikan.
Meringkaskan
Tiga strategi perdagangan kuantitatif supertrend, menggunakan verifikasi indikator tren ganda untuk meningkatkan akurasi keputusan, stop loss dan kontrol risiko / reward ratio, cocok untuk perdagangan garis pendek frekuensi tinggi. Parameter optimasi dapat disesuaikan dengan siklus perdagangan yang lebih lama, mengurangi probabilitas sinyal yang salah, meningkatkan efek stop loss.
Source
Pine
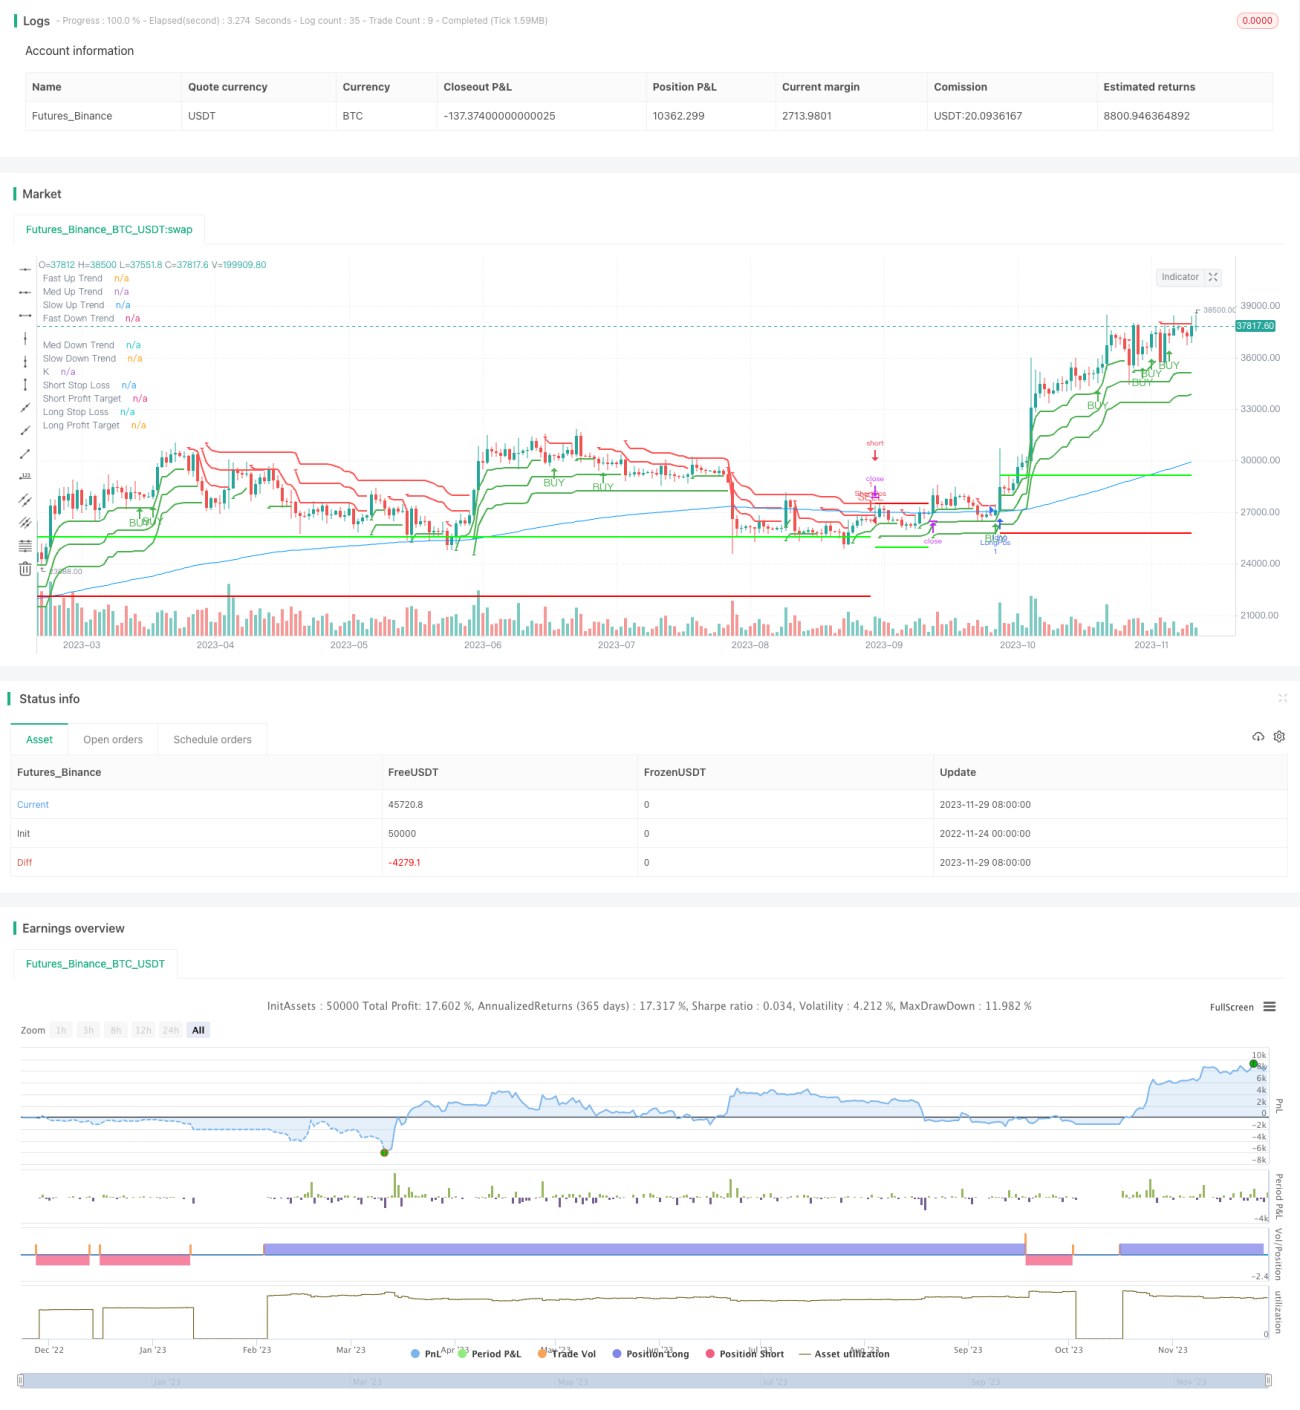
/*backtest
start: 2022-11-24 00:00:00
end: 2023-11-30 00:00:00
period: 1d
basePeriod: 1h
exchanges: [{"eid":"Futures_Binance","currency":"BTC_USDT"}]
*/

//@version=4
strategy("3x SuperTrend Strategy (Mel0nTek) V1", calc_on_every_tick=true, overlay=true)

// ***************************************************Strategy parameters
Related strategies
Comment
All comments (0)
No data
- 1