概述
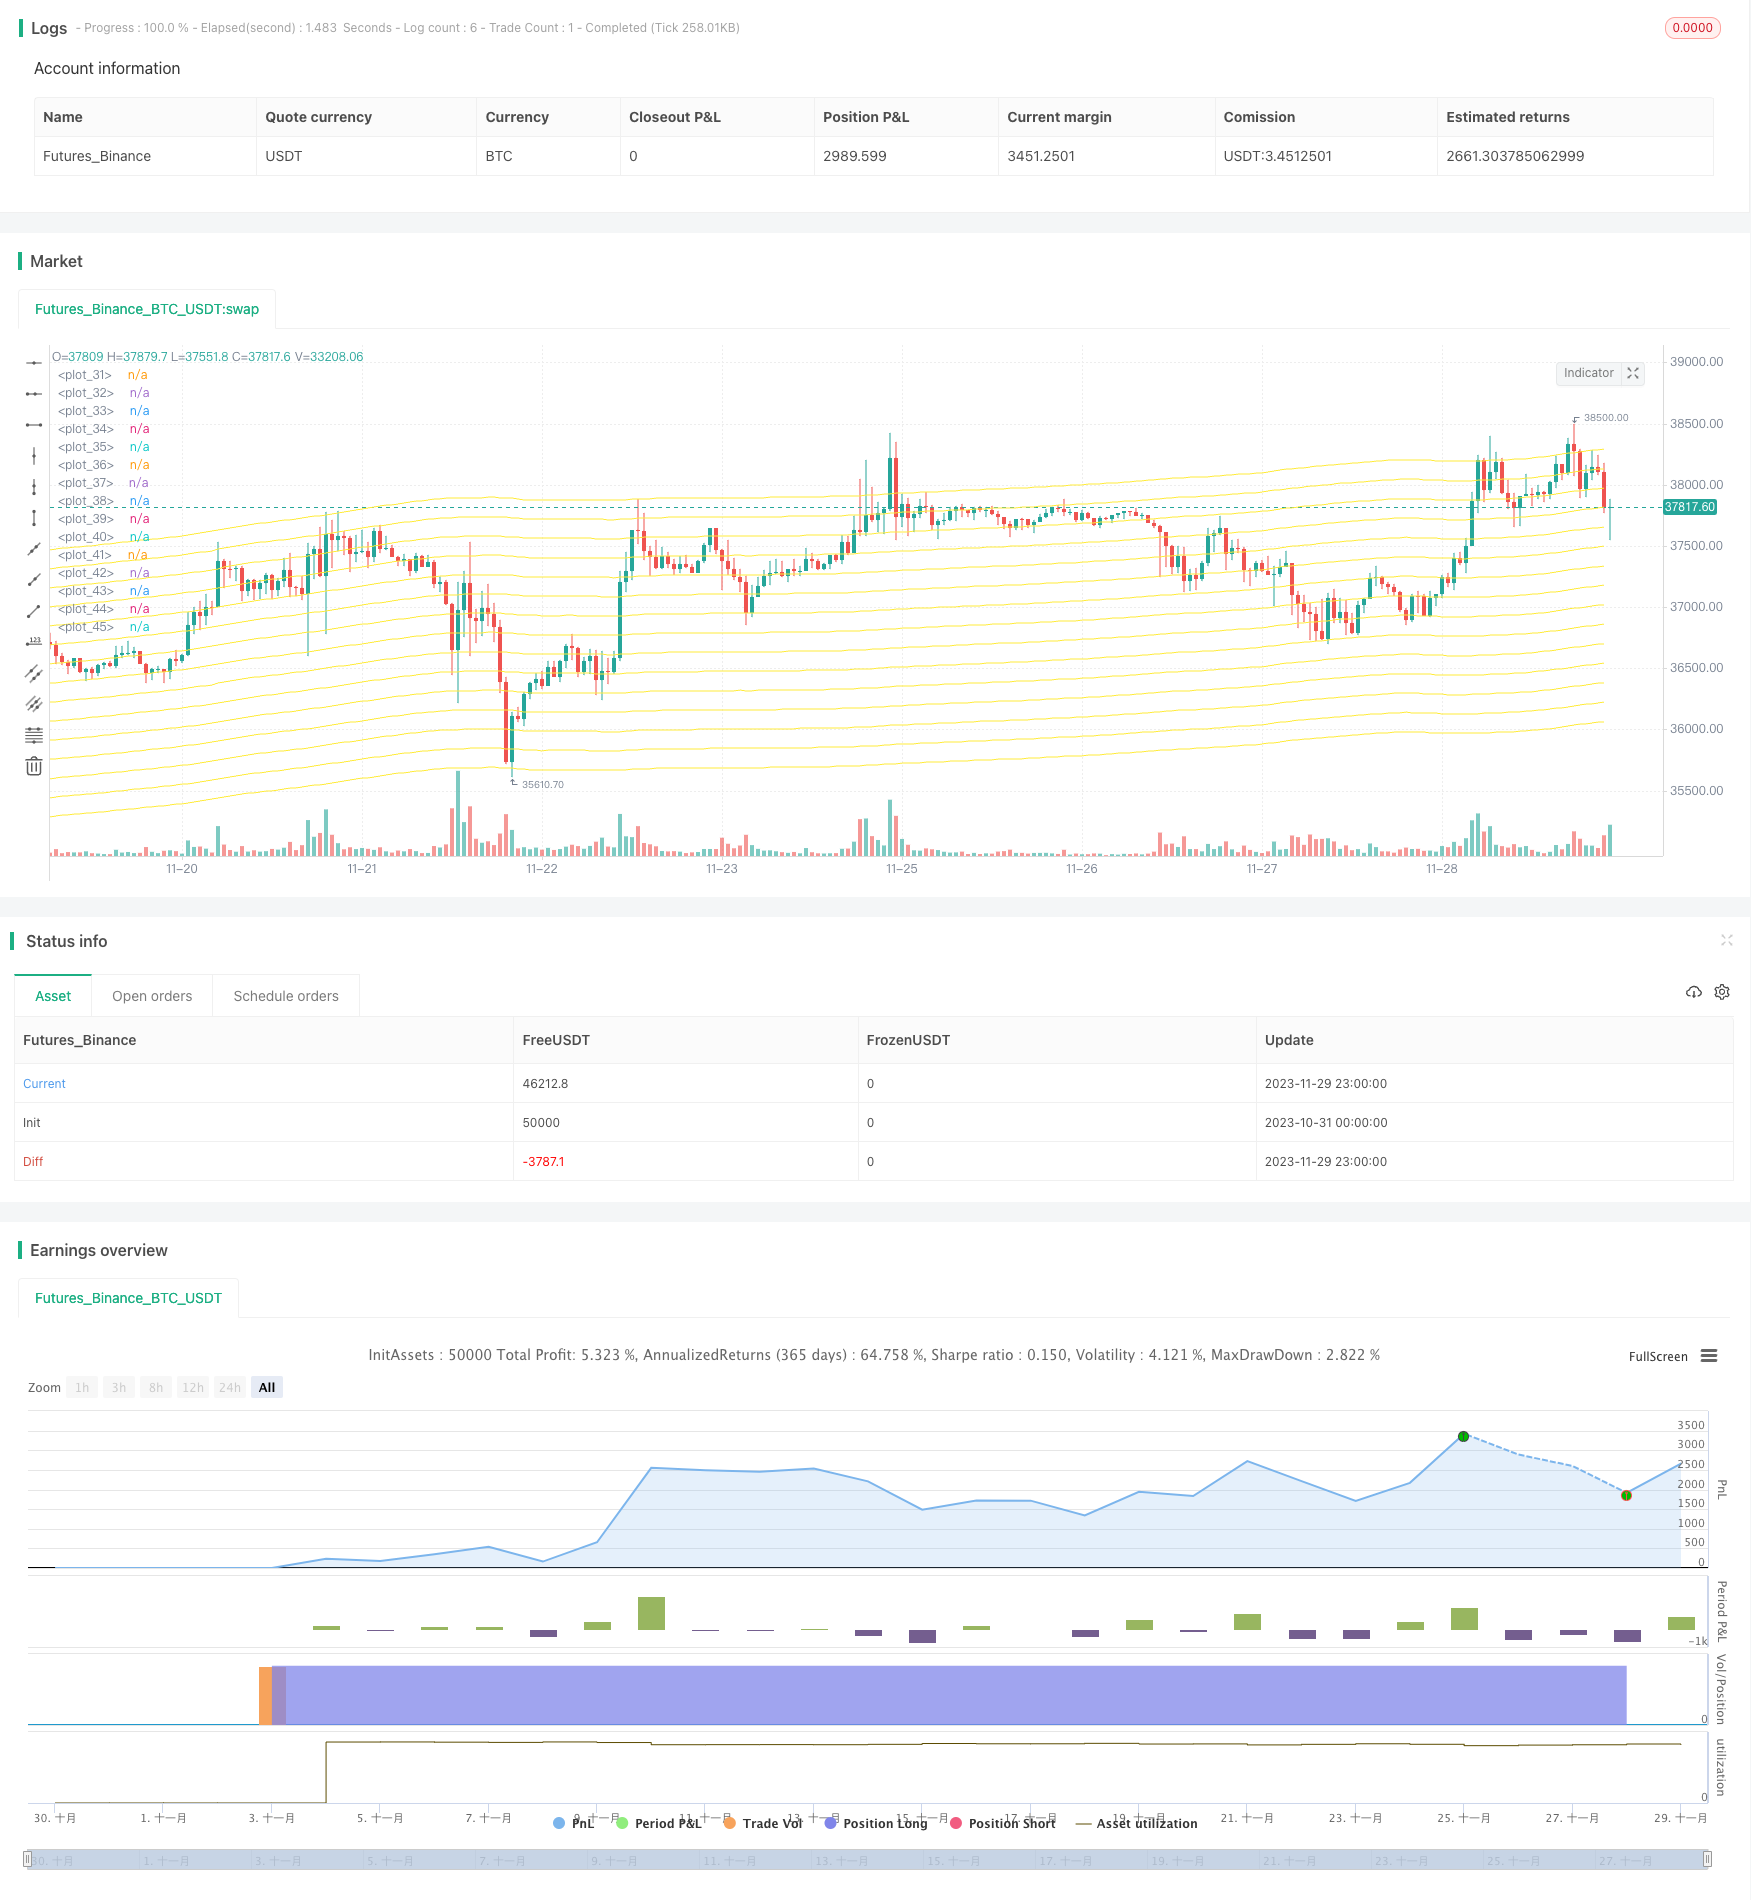
动态网格交易策略通过计算移动平均线及其上下轨,动态设定网格交易区间。当价格突破网格区间时,按照固定间距设定的网格线发出交易信号,实现盈利。
策略原理
该策略首先计算定义期间n的移动平均线,以及移动平均线上下轨。上轨为移动平均线(1 + 输入参数std),下轨为移动平均线(1 - 输入参数std)。这样可以构建出一个动态调整的交易区间带。
然后在区间带内,我们定义m条等间距的网格线。当价格上涨突破某条网格线时,在该网格线发出做多信号;当价格下跌突破某条网格线时,在该网格线对应的上一根网格线发出平仓信号。通过这个反向操作,可以在价格波动的时候获利。
具体来说,我们用一个bool型数组order_array来记录每条网格线的交易状态。当某一根网格线触发做多条件时,把order_array中对应的状态置为true,表示该网格线已有持仓。当价格下跌突破网格线时,把order_array中对应的上一根网格线状态置为false,发出平仓信号。
优势分析
该策略有以下几个优势:
利用移动平均线构建动态调整的交易区间,可以根据市场波动性调整区间范围,使策略更加适应市场。
网格设计可以自动进行止盈止损,防止极端行情导致的亏损扩大。
网格数量和资金分配采用等间距和等额分配,可以很好控制单笔仓位规模,降低单笔仓位风险。
做多和平仓信号设置合理,可以顺势交易,及时止盈止损。
风险分析
该策略也存在一些风险:
当市场出现长期疲软,无法突破网格线时,策略将陷入无方向的震荡交易中,多空交替可能造成账户资金流失。
选择的参数std和网格数量可能并不完全合理,需要根据不同交易品种分析确定。如果参数设定不当,将导致交易区间和网格过大或过小,影响策略效果。
策略没有考虑到一些极端行情的情况,如价格跳空、短线爆炸式上涨或下跌等情况。这些情况可能会导致策略突破多个网格,造成超出风险控制的亏损。
优化方向
该策略还可以从以下几个方面进行优化:
可以引入机器学习算法,训练模型预测移动平均线上下轨,使交易区间更加智能和动态。
可以根据不同交易标的的特点,优化网格数量、资金分配比例、仓位规模等参数,使用自适应参数。
可以设置条件单,在一定距离的网格线上设置备用止损单,可以起到事先止损的作用,控制极端行情下的亏损。
对极端行情情况设计异常处理机制,如加大首次开仓仓位,跳过中间网格直接止损等,可以应对价格跳空等异常情况。
总结
动态网格交易策略整体设计合理,可以利用网格构建自动止盈止损系统,适合那些价格波动比较频繁的交易品种。但该策略也存在一定的市场风险,需要对参数及异常情况进行优化处理,才能使策略更加稳健。
/*backtest
start: 2023-10-31 00:00:00
end: 2023-11-30 00:00:00
period: 1h
basePeriod: 15m
exchanges: [{"eid":"Futures_Binance","currency":"BTC_USDT"}]
*/

//@version=5
strategy('Grid Trading Strategy', overlay=true)

// Input
ma_length = input.int(300, 'Moving Average Length',group = 'Moving Average Conditions', step = 10)
std = input.float(0.03, title='Upper and Lower Grid Deviation', group='Grid Conditions', step = 0.01)
grid = input.int(15, maxval=15, title='Grid Line Quantity', group='Grid Conditions')

// Moving Average
ma = ta.sma(close, ma_length)
upper_bound = ma * (1 + std)
lower_bound = ma * (1 - std)
grid_width = (upper_bound - lower_bound) / (grid - 1)
grid_array = array.new_float(0)
for i = 0 to grid - 1 by 1
    array.push(grid_array, lower_bound + grid_width * i)
var order_array = array.new_bool(grid, false)
strategy.initial_capital = 10000
// Entry Conditions
for i = 0 to grid - 1 by 1
    if close < array.get(grid_array, i) and not array.get(order_array, i)
        buy_id = i
        array.set(order_array, buy_id, true)
        strategy.entry(id=str.tostring(buy_id), direction=strategy.long, comment='#Long ' + str.tostring(buy_id))
    if close > array.get(grid_array, i) and i!=0
        if array.get(order_array, i-1)
            sell_id = i - 1
            array.set(order_array, sell_id, false)
            strategy.close(id=str.tostring(sell_id), comment='#Close ' + str.tostring(sell_id))

plot(grid > 0 ? array.get(grid_array,0) : na, color = color.yellow, transp = 10)
plot(grid > 1 ? array.get(grid_array,1) : na, color = color.yellow, transp = 10)
plot(grid > 2 ? array.get(grid_array,2) : na, color = color.yellow, transp = 10)
plot(grid > 3 ? array.get(grid_array,3) : na, color = color.yellow, transp = 10)
plot(grid > 4 ? array.get(grid_array,4) : na, color = color.yellow, transp = 10)
plot(grid > 5 ? array.get(grid_array,5) : na, color = color.yellow, transp = 10)
plot(grid > 6 ? array.get(grid_array,6) : na, color = color.yellow, transp = 10)
plot(grid > 7 ? array.get(grid_array,7) : na, color = color.yellow, transp = 10)
plot(grid > 8 ? array.get(grid_array,8) : na, color = color.yellow, transp = 10)
plot(grid > 9 ? array.get(grid_array,9) : na, color = color.yellow, transp = 10)
plot(grid > 10 ? array.get(grid_array,10) : na, color = color.yellow, transp = 10)
plot(grid > 11 ? array.get(grid_array,11) : na, color = color.yellow, transp = 10)
plot(grid > 12 ? array.get(grid_array,12) : na, color = color.yellow, transp = 10)
plot(grid > 13 ? array.get(grid_array,13) : na, color = color.yellow, transp = 10)
plot(grid > 14 ? array.get(grid_array,14) : na, color = color.yellow, transp = 10)