Strategi Kuberan: Strategi Interseksi untuk Pengendalian Pasar
Tinjauan Strategi
Strategi Kuberan adalah strategi trading yang kuat yang ditulis oleh Kathir. Strategi ini menggabungkan berbagai teknik analisis untuk membentuk metode trading yang unik dan kuat. Strategi ini dinamai Kuberan, dewa kekayaan, yang melambangkan tujuan portofolio investornya yang kaya.
Kuberan lebih dari sekedar strategi, Kuberan adalah sistem perdagangan yang komprehensif. Kuberan menggabungkan analisis tren, indikator momentum, dan indikator volume transaksi untuk mengidentifikasi peluang perdagangan dengan probabilitas tinggi.
Prinsip Strategi
Inti dari strategi Kuberan adalah prinsip konvergensi multi-indikator. Ini memanfaatkan kombinasi indikator yang unik, yang bekerja sama dengan satu sama lain untuk mengurangi kebisingan dan sinyal yang salah. Secara khusus, strategi ini menggunakan beberapa komponen kunci berikut:
- Menentukan arah tren: menilai arah tren saat ini dengan membandingkan harga saat ini dengan titik dukungan dan resistensi.
- Dukungan dan Resistensi: Identifikasi Dukungan dan Resistensi yang penting melalui indikator zigzag dan titik pivot.
- Penghakiman deviasi: dengan membandingkan pergerakan harga dengan indikator momentum, menilai apakah ada deviasi yang muncul, yang menunjukkan adanya pembalikan tren potensial.
- Adaptasi Volatilitas: Mengatur stop loss secara dinamis melalui indikator ATR untuk menyesuaikan dengan berbagai volatilitas pasar.
- Pengertian K-linearity: Mengkonfirmasi tren dan sinyal pembalikan melalui kombinasi K-linearitas tertentu.
Dengan mempertimbangkan faktor-faktor di atas secara komprehensif, strategi Kuberan mampu beradaptasi dengan berbagai lingkungan pasar untuk menangkap peluang perdagangan dengan probabilitas tinggi.
Keunggulan Strategis
- Multi-indicator overlap: Strategi Kuberan memanfaatkan sinergi dari beberapa indikator, yang secara signifikan meningkatkan keandalan sinyal dan mengurangi gangguan noise.
- Adaptif: Dengan menyesuaikan parameter secara dinamis, strategi ini dapat beradaptasi dengan lingkungan pasar yang berubah-ubah dan tidak mudah gagal.
- Sinyal yang jelas: Kuberan menyediakan sinyal masuk dan keluar yang jelas, yang menyederhanakan proses pengambilan keputusan perdagangan.
- Strategi ini telah diuji secara historis secara ketat dan telah menunjukkan kinerja yang stabil di berbagai kondisi pasar.
- Berbagai kegunaan: Kuberan cocok untuk berbagai pasar dan varietas, tidak terbatas pada merek dagang tertentu.
Risiko Strategis
- Sensitivitas parameter: Kinerja strategi Kuberan sangat sensitif terhadap pilihan parameter, dan parameter yang tidak tepat dapat menyebabkan penurunan kinerja.
- Kejadian yang tidak terduga: Strategi ini didasarkan pada sinyal teknis dan memiliki kemampuan terbatas untuk menanggapi kejadian yang tidak terduga.
- Risiko overadaptasi: Jika terlalu banyak data historis dipertimbangkan saat mengoptimalkan parameter, ini dapat menyebabkan strategi terlalu banyak beradaptasi dengan masa lalu dan mengurangi adaptasi terhadap situasi masa depan.
- Risiko Leverage: Jika Anda menggunakan Leverage yang tinggi, Anda akan menghadapi risiko Bust dalam penarikan besar.
Untuk risiko di atas, langkah-langkah pengendalian yang tepat dapat diambil, seperti penyesuaian parameter secara teratur, pengaturan stop loss yang wajar, kontrol leverage yang moderat, perhatian terhadap perubahan fundamental, dll.
Arah optimasi
- Optimasi Pembelajaran Mesin: Algoritma pembelajaran mesin dapat diperkenalkan untuk mengoptimalkan parameter strategi secara dinamis dan meningkatkan adaptasi.
- Menambahkan faktor fundamental: Pertimbangkan untuk memasukkan analisis fundamental ke dalam keputusan perdagangan untuk mengatasi kegagalan sinyal teknis.
- Manajemen portofolio: Pada tingkat manajemen dana, strategi Kuberan dapat dimasukkan ke dalam portofolio investasi, dengan strategi lain untuk membuat perisai yang efektif.
- Optimasi segmen pasar: karakteristik untuk varietas pasar yang berbeda, parameter strategi optimasi khusus.
- Transformasi frekuensi tinggi: mengubah strategi menjadi versi perdagangan frekuensi tinggi untuk menangkap lebih banyak peluang perdagangan garis pendek.
Meringkaskan
Kuberan adalah strategi perdagangan yang kuat, aman, dan andal. Ini menggabungkan beberapa metode analisis teknis dengan cerdik, dengan prinsip pertukaran indikator, yang sangat baik dalam menangkap tren dan menangkap titik balik. Meskipun strategi apa pun tidak dapat dihindari dari risiko, Kuberan telah membuktikan ketahananannya dalam pengujian ulang, dan dengan kontrol risiko dan pengoptimalan yang tepat, percaya bahwa strategi ini dapat membantu pedagang untuk mendapatkan keuntungan dari permainan pasar dan mendorong pertumbuhan portofolio yang stabil dan kuat dalam jangka panjang.
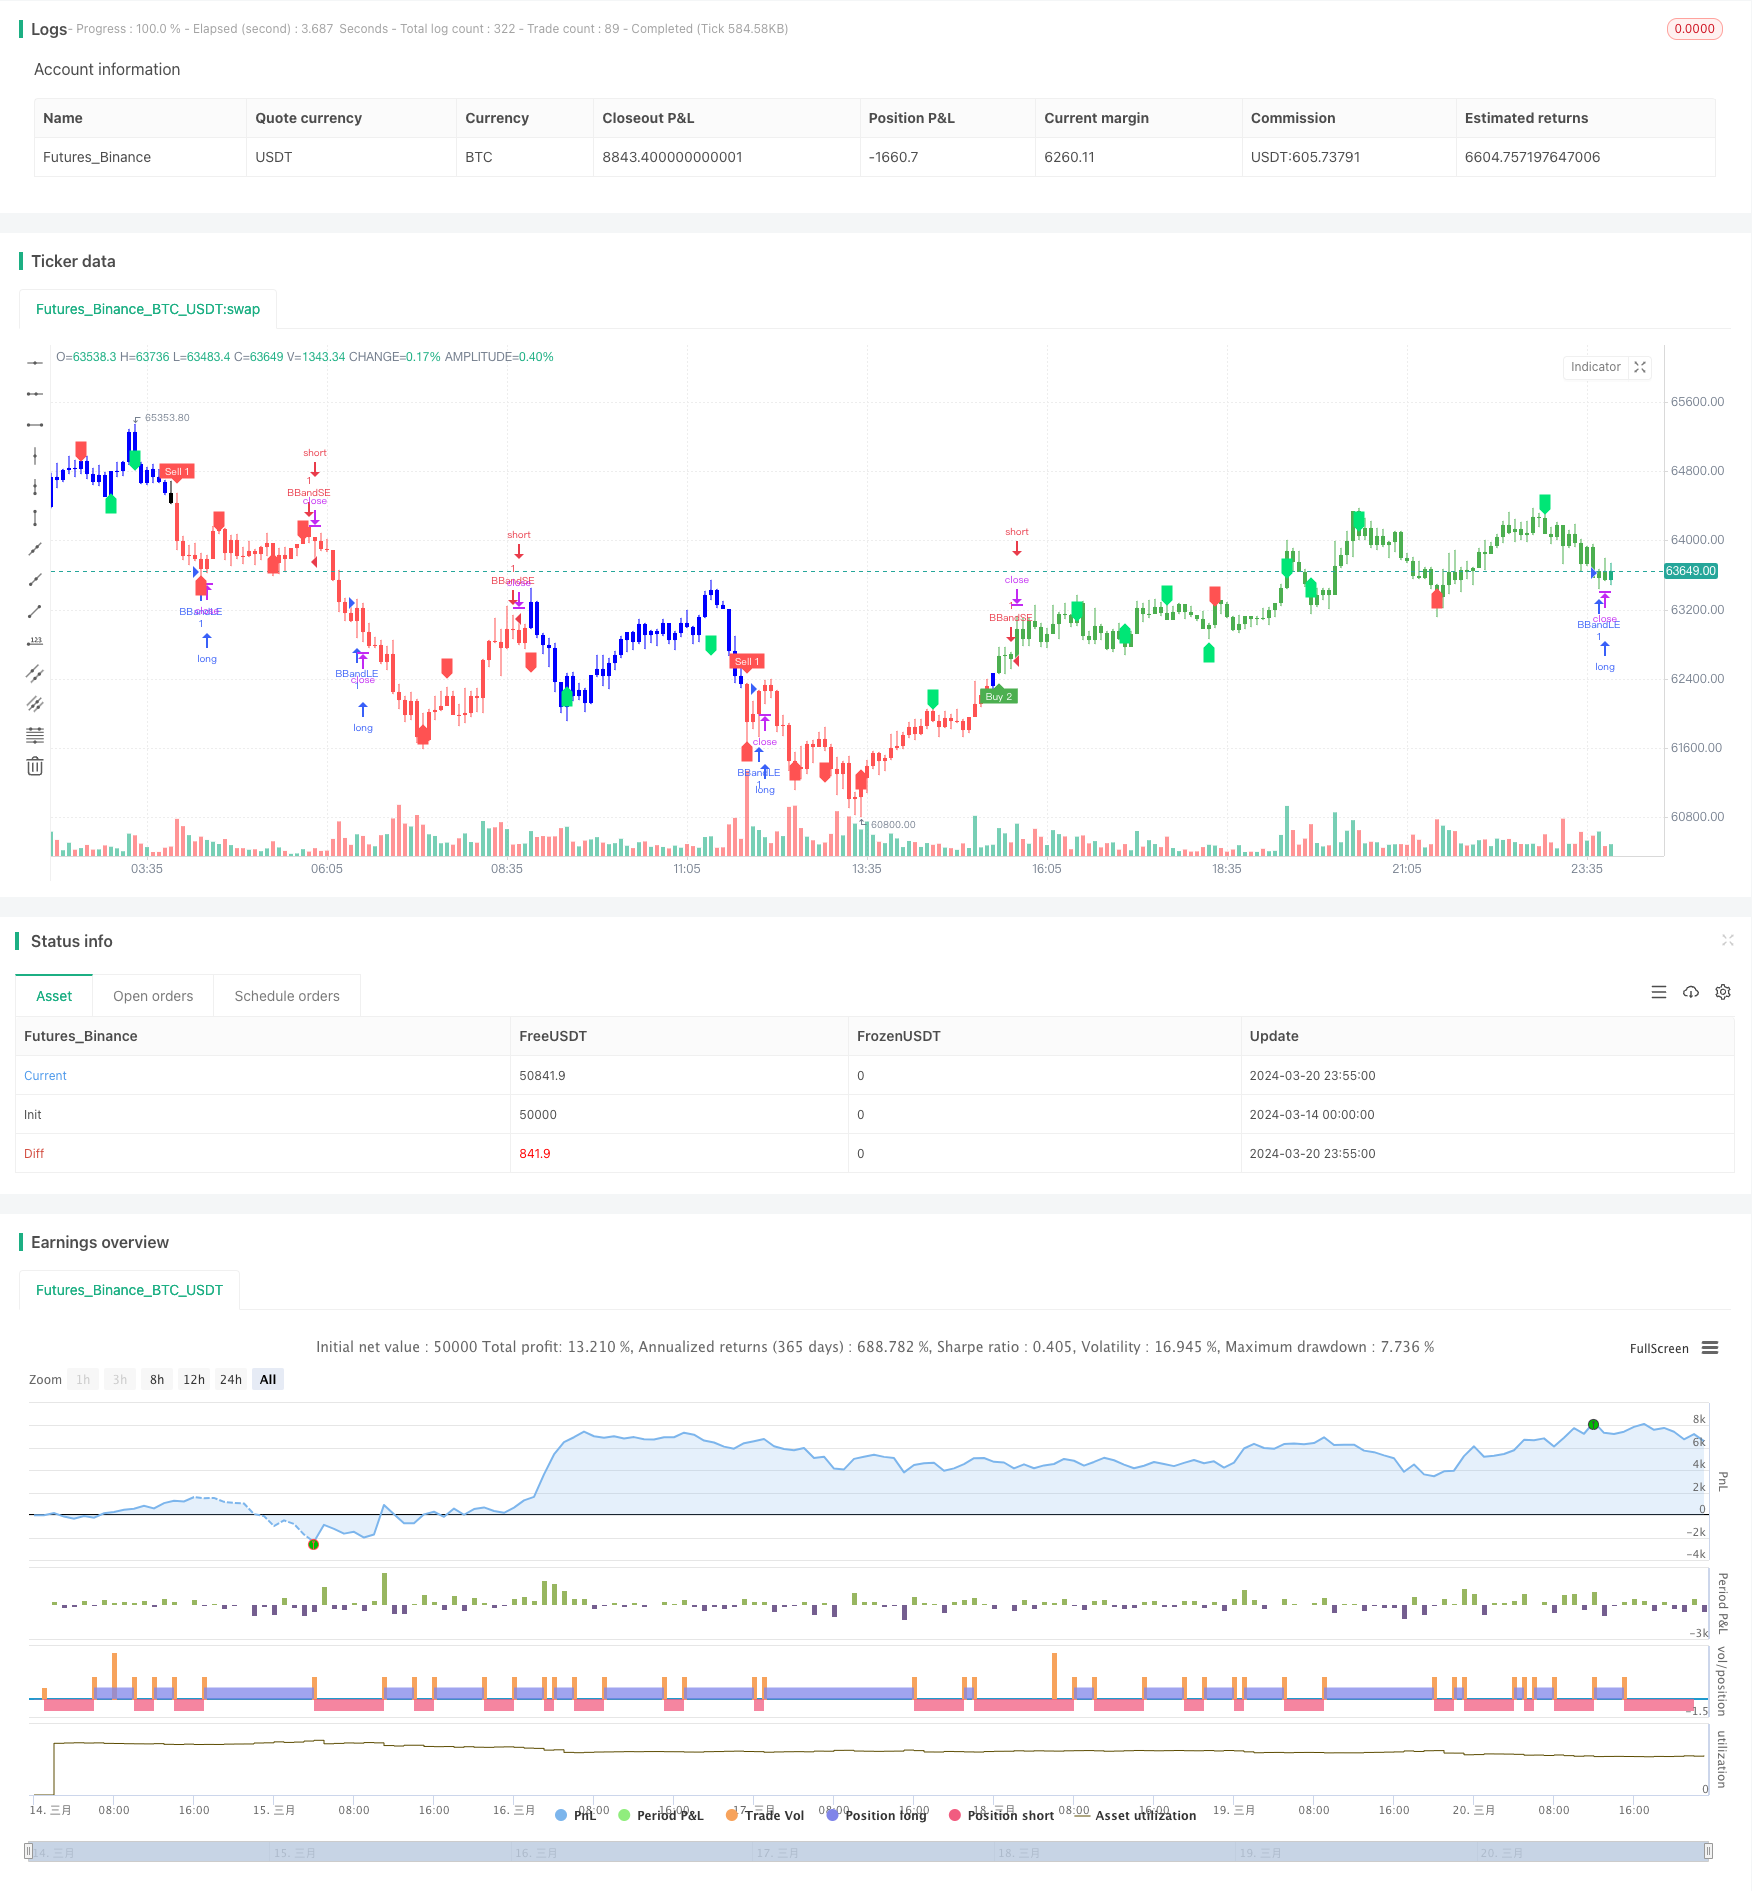
/*backtest
start: 2024-03-14 00:00:00
end: 2024-03-21 00:00:00
period: 5m
basePeriod: 1m
exchanges: [{"eid":"Futures_Binance","currency":"BTC_USDT"}]
*/

// This source code is subject to the terms of the Mozilla Public License 2.0 at https://mozilla.org/MPL/2.0/
// © LonesomeThecolor.blue
// This source code is subject to the terms of the Mozilla Public License 2.0 at https://mozilla.org/MPL/2.0/
// © LonesomeThecolor.blue

//@version=5
strategy('Kuberan*', overlay=true, max_lines_count=500)
lb = input.int(5, title='Left Bars', minval=1)
rb = input.int(5, title='Right Bars', minval=1)
showsupres = input.bool(false, title='Support/Resistance', inline='srcol')
supcol = input.color(color.lime, title='', inline='srcol')
rescol = input.color(color.red, title='', inline='srcol')
// srlinestyle = input(line.style_dotted, title='Line Style/Width', inline='style')
srlinewidth = input.int(3, title='', minval=1, maxval=5, inline='style')
changebarcol = input.bool(true, title='Change Bar Color', inline='bcol')
bcolup = input.color(color.blue, title='', inline='bcol')
bcoldn = input.color(color.black, title='', inline='bcol')

ph = ta.pivothigh(lb, rb)
pl = ta.pivotlow(lb, rb)

iff_1 = pl ? -1 : na  // Trend direction
hl = ph ? 1 : iff_1
iff_2 = pl ? pl : na  // similar to zigzag but may have multTLiple highs/lows
zz = ph ? ph : iff_2
valuewhen_1 = ta.valuewhen(hl, hl, 1)
valuewhen_2 = ta.valuewhen(zz, zz, 1)
zz := pl and hl == -1 and valuewhen_1 == -1 and pl > valuewhen_2 ? na : zz
valuewhen_3 = ta.valuewhen(hl, hl, 1)
valuewhen_4 = ta.valuewhen(zz, zz, 1)
zz := ph and hl == 1 and valuewhen_3 == 1 and ph < valuewhen_4 ? na : zz

valuewhen_5 = ta.valuewhen(hl, hl, 1)
valuewhen_6 = ta.valuewhen(zz, zz, 1)
hl := hl == -1 and valuewhen_5 == 1 and zz > valuewhen_6 ? na : hl
valuewhen_7 = ta.valuewhen(hl, hl, 1)
valuewhen_8 = ta.valuewhen(zz, zz, 1)
hl := hl == 1 and valuewhen_7 == -1 and zz < valuewhen_8 ? na : hl
zz := na(hl) ? na : zz

findprevious() =>  // finds previous three points (b, c, d, e)
    ehl = hl == 1 ? -1 : 1
    loc1 = 0.0
    loc2 = 0.0
    loc3 = 0.0
    loc4 = 0.0
    xx = 0
    for x = 1 to 1000 by 1
        if hl[x] == ehl and not na(zz[x])
            loc1 := zz[x]
            xx := x + 1
            break
    ehl := hl
    for x = xx to 1000 by 1
        if hl[x] == ehl and not na(zz[x])
            loc2 := zz[x]
            xx := x + 1
            break
    ehl := hl == 1 ? -1 : 1
    for x = xx to 1000 by 1
        if hl[x] == ehl and not na(zz[x])
            loc3 := zz[x]
            xx := x + 1
            break
    ehl := hl
    for x = xx to 1000 by 1
        if hl[x] == ehl and not na(zz[x])
            loc4 := zz[x]
            break
    [loc1, loc2, loc3, loc4]

float a = na
float b = na
float c = na
float d = na
float e = na
if not na(hl)
    [loc1, loc2, loc3, loc4] = findprevious()
    a := zz
    b := loc1
    c := loc2
    d := loc3
    e := loc4
    e

_hh = zz and a > b and a > c and c > b and c > d
_ll = zz and a < b and a < c and c < b and c < d
_hl = zz and (a >= c and b > c and b > d and d > c and d > e or a < b and a > c and b < d)
_lh = zz and (a <= c and b < c and b < d and d < c and d < e or a > b and a < c and b > d)

plotshape(_hl, title='Higher Low', style=shape.labelup, color=color.new(color.lime, 0), textcolor=color.new(color.black, 0), location=location.belowbar, offset=-rb)
plotshape(_hh, title='Higher High', style=shape.labeldown, color=color.new(color.lime, 0), textcolor=color.new(color.black, 0), location=location.abovebar, offset=-rb)
plotshape(_ll, title='Lower Low', style=shape.labelup, color=color.new(color.red, 0), textcolor=color.new(color.white, 0), location=location.belowbar, offset=-rb)
plotshape(_lh, title='Lower High', style=shape.labeldown, color=color.new(color.red, 0), textcolor=color.new(color.white, 0), location=location.abovebar, offset=-rb)

float res = na
float sup = na
res := _lh ? zz : res[1]
sup := _hl ? zz : sup[1]

int trend = na
iff_3 = close < sup ? -1 : nz(trend[1])
trend := close > res ? 1 : iff_3

res := trend == 1 and _hh or trend == -1 and _lh ? zz : res
sup := trend == 1 and _hl or trend == -1 and _ll ? zz : sup
rechange = res != res[1]
suchange = sup != sup[1]

var line resline = na
var line supline = na
if showsupres
    if rechange
        line.set_x2(resline, bar_index)
        line.set_extend(resline, extend=extend.none)
        resline := line.new(x1=bar_index - rb, y1=res, x2=bar_index, y2=res, color=rescol, extend=extend.right, style=line.style_dotted, width=srlinewidth)
        resline

    if suchange
        line.set_x2(supline, bar_index)
        line.set_extend(supline, extend=extend.none)
        supline := line.new(x1=bar_index - rb, y1=sup, x2=bar_index, y2=sup, color=supcol, extend=extend.right, style=line.style_dotted, width=srlinewidth)
        supline

iff_4 = trend == 1 ? bcolup : bcoldn
barcolor(color=changebarcol ? iff_4 : na)


// Inputs
A1 = input(5, title='Key Value. \'This changes the sensitivity\' for sell1')
C1 = input(400, title='ATR Period for sell1')
A2 = input(6, title='Key Value. \'This changes the sensitivity\' for buy2')
C2 = input(1, title='ATR Period for buy2')
h = input(false, title='Signals from Heikin Ashi Candles')

xATR1 = ta.atr(C1)
xATR2 = ta.atr(C2)
nLoss1 = A1 * xATR1
nLoss2 = A2 * xATR2

src = h ? request.security(ticker.heikinashi(syminfo.tickerid), timeframe.period, close, lookahead=barmerge.lookahead_off) : close

xATRTrailingStop1 = 0.0
iff_5 = src > nz(xATRTrailingStop1[1], 0) ? src - nLoss1 : src + nLoss1
iff_6 = src < nz(xATRTrailingStop1[1], 0) and src[1] < nz(xATRTrailingStop1[1], 0) ? math.min(nz(xATRTrailingStop1[1]), src + nLoss1) : iff_5
xATRTrailingStop1 := src > nz(xATRTrailingStop1[1], 0) and src[1] > nz(xATRTrailingStop1[1], 0) ? math.max(nz(xATRTrailingStop1[1]), src - nLoss1) : iff_6

xATRTrailingStop2 = 0.0
iff_7 = src > nz(xATRTrailingStop2[1], 0) ? src - nLoss2 : src + nLoss2
iff_8 = src < nz(xATRTrailingStop2[1], 0) and src[1] < nz(xATRTrailingStop2[1], 0) ? math.min(nz(xATRTrailingStop2[1]), src + nLoss2) : iff_7
xATRTrailingStop2 := src > nz(xATRTrailingStop2[1], 0) and src[1] > nz(xATRTrailingStop2[1], 0) ? math.max(nz(xATRTrailingStop2[1]), src - nLoss2) : iff_8

pos1 = 0
iff_9 = src[1] > nz(xATRTrailingStop1[1], 0) and src < nz(xATRTrailingStop1[1], 0) ? -1 : nz(pos1[1], 0)
pos1 := src[1] < nz(xATRTrailingStop1[1], 0) and src > nz(xATRTrailingStop1[1], 0) ? 1 : iff_9

pos2 = 0
iff_10 = src[1] > nz(xATRTrailingStop2[1], 0) and src < nz(xATRTrailingStop2[1], 0) ? -1 : nz(pos2[1], 0)
pos2 := src[1] < nz(xATRTrailingStop2[1], 0) and src > nz(xATRTrailingStop2[1], 0) ? 1 : iff_10

xcolor1 = pos1 == -1 ? color.red : pos1 == 1 ? color.green : color.blue
xcolor2 = pos2 == -1 ? color.red : pos2 == 1 ? color.green : color.blue

ema1 = ta.ema(src, 1)
ema2 = ta.ema(src, 1)
above1 = ta.crossover(ema1, xATRTrailingStop1)
below1 = ta.crossover(xATRTrailingStop1, ema1)
above2 = ta.crossover(ema2, xATRTrailingStop2)
below2 = ta.crossover(xATRTrailingStop2, ema2)

buy1 = src > xATRTrailingStop1 and above1
sell1 = src < xATRTrailingStop1 and below1
buy2 = src > xATRTrailingStop2 and above2
sell2 = src < xATRTrailingStop2 and below2

barbuy1 = src > xATRTrailingStop1
barsell1 = src < xATRTrailingStop1
barbuy2 = src > xATRTrailingStop2
barsell2 = src < xATRTrailingStop2

// plotshape(buy1, title="Buy 1", text='Buy 1', style=shape.labelup, location=location.belowbar, color=color.green, textcolor=color.white, transp=0, size=size.tiny)
plotshape(sell1, title='Sell 1', text='Sell 1', style=shape.labeldown, location=location.abovebar, color=color.new(color.red, 0), textcolor=color.new(color.white, 0), size=size.tiny)
plotshape(buy2, title='Buy 2', text='Buy 2', style=shape.labelup, location=location.belowbar, color=color.new(color.green, 0), textcolor=color.new(color.white, 0), size=size.tiny)
// plotshape(sell2, title="Sell 2", text='Sell 2', style=shape.labeldown, location=location.abovebar, color=color.red, textcolor=color.white, transp=0, size=size.tiny)

// barcolor(barbuy1 ? color.green : na)
barcolor(barsell1 ? color.red : na)
barcolor(barbuy2 ? color.green : na)
// barcolor(barsell2 ? color.red : na)

// alertcondition(buy1, "UT Long 1", "UT Long 1")
alertcondition(sell1, 'UT Short 1', 'UT Short 1')
alertcondition(buy2, 'UT Long 2', 'UT Long 2')

// strategy.entry('long', strategy.long, when=buy2)
source = close
length = input.int(20, minval=1)
mult = input.float(2.0, minval=0.001, maxval=50)
basis = ta.sma(source, length)
dev = mult * ta.stdev(source, length)
upper = basis + dev
lower = basis - dev
buyEntry = ta.crossover(source, lower)
sellEntry = ta.crossunder(source, upper)
if (ta.crossover(source, lower) )
	strategy.entry("BBandLE", strategy.long, stop=lower, oca_name="BollingerBands",  comment="BBandLE")
else
	strategy.cancel(id="BBandLE")
if (ta.crossunder(source, upper))
	strategy.entry("BBandSE", strategy.short, stop=upper, oca_name="BollingerBands",comment="BBandSE")
else
	strategy.cancel(id="BBandSE")
//plot(strategy.equity, title="equity", color=color.red, linewidth=2, style=plot.style_areabr)

lengthTL = input.int(14, 'Swing Detection Lookback')
multTL = input.float(1., 'Slope', minval = 0, step = .1)
calcMethod = input.string('Atr', 'Slope Calculation Method', options = ['Atr','Stdev','Linreg'])
backpaint = input(true, tooltip = 'Backpainting offset displayed elements in the past. Disable backpainting to see real time information returned by the indicator.')

//Style
upCss = input.color(color.teal, 'Up Trendline Color', group = 'Style')
dnCss = input.color(color.red, 'Down Trendline Color', group = 'Style')
showExt = input(true, 'Show Extended Lines')

//-----------------------------------------------------------------------------}
//Calculations
//-----------------------------------------------------------------------------{
var upperTL = 0.
var lowerTL = 0.
var slope_phTL = 0.
var slope_plTL = 0.

var offset = backpaint ? lengthTL : 0

n = bar_index
srcTL = close

phTL = ta.pivothigh(lengthTL, lengthTL)
plTL = ta.pivotlow(lengthTL, lengthTL)

//Slope Calculation Method
slope = switch calcMethod
    'Atr'    => ta.atr(lengthTL) / lengthTL * multTL
    'Stdev'  => ta.stdev(srcTL,lengthTL) / lengthTL * multTL
    'Linreg' => math.abs(ta.sma(srcTL * n, lengthTL) - ta.sma(srcTL, lengthTL) * ta.sma(n, lengthTL)) / ta.variance(n, lengthTL) / 2 * multTL

//Get slopes and calculate trendlines
slope_phTL := phTL ? slope : slope_phTL
slope_plTL := plTL ? slope : slope_plTL

upperTL := phTL ? phTL : upperTL - slope_phTL
lowerTL := pl ? pl : lowerTL + slope_plTL

var upos = 0
var dnos = 0
upos := phTL ? 0 : close > upperTL - slope_phTL * lengthTL ? 1 : upos
dnos := pl ? 0 : close < lowerTL + slope_plTL * lengthTL ? 1 : dnos