トレンドスカルプ-フラクタルボックス-3EMA
作者: リン・ハーンチャオチャン, 日時: 2022-05-23 11:45:02タグ:エイマ
ウィリアムズ・フラクタルとアリゲーターのインディケーターはたくさんあります. EMAsを使用する多くの場合,トレンドスケープのために3EMAリボンとフラクタルレベル/ボックス (上と下のフラクタル間のバックグラウンドを埋める) を組み合わせて定義することは有用かもしれません.私はコミュニティでこのタイプのインディケーターを探しました.一部はフラクタル,一部はレベルだけ,一部はアリゲーターなどを示していますが,必要なものは見つかりませんでした.したがって,他のユーザーにも興味があるかもしれないこのインディケーターを考えました.
主要 な 点:
EMAリボンには3つのEMA
免責事項:この指標は,教育的な参考のためにのみ作成されており,投資アドバイスを構成するものではありません.この指標は,実際の取引決定を下す前に,広範な独立した市場調査の代替として信頼されるべきではありません.市場データまたはその他のコンテンツは,通知なしにいつでも変更される可能性があります.この指標の使用によって直接または間接的に生じる損失または損害,制限なく利益の損失を含むすべての責任は,それを使用するユーザーの責任です.
バックテスト
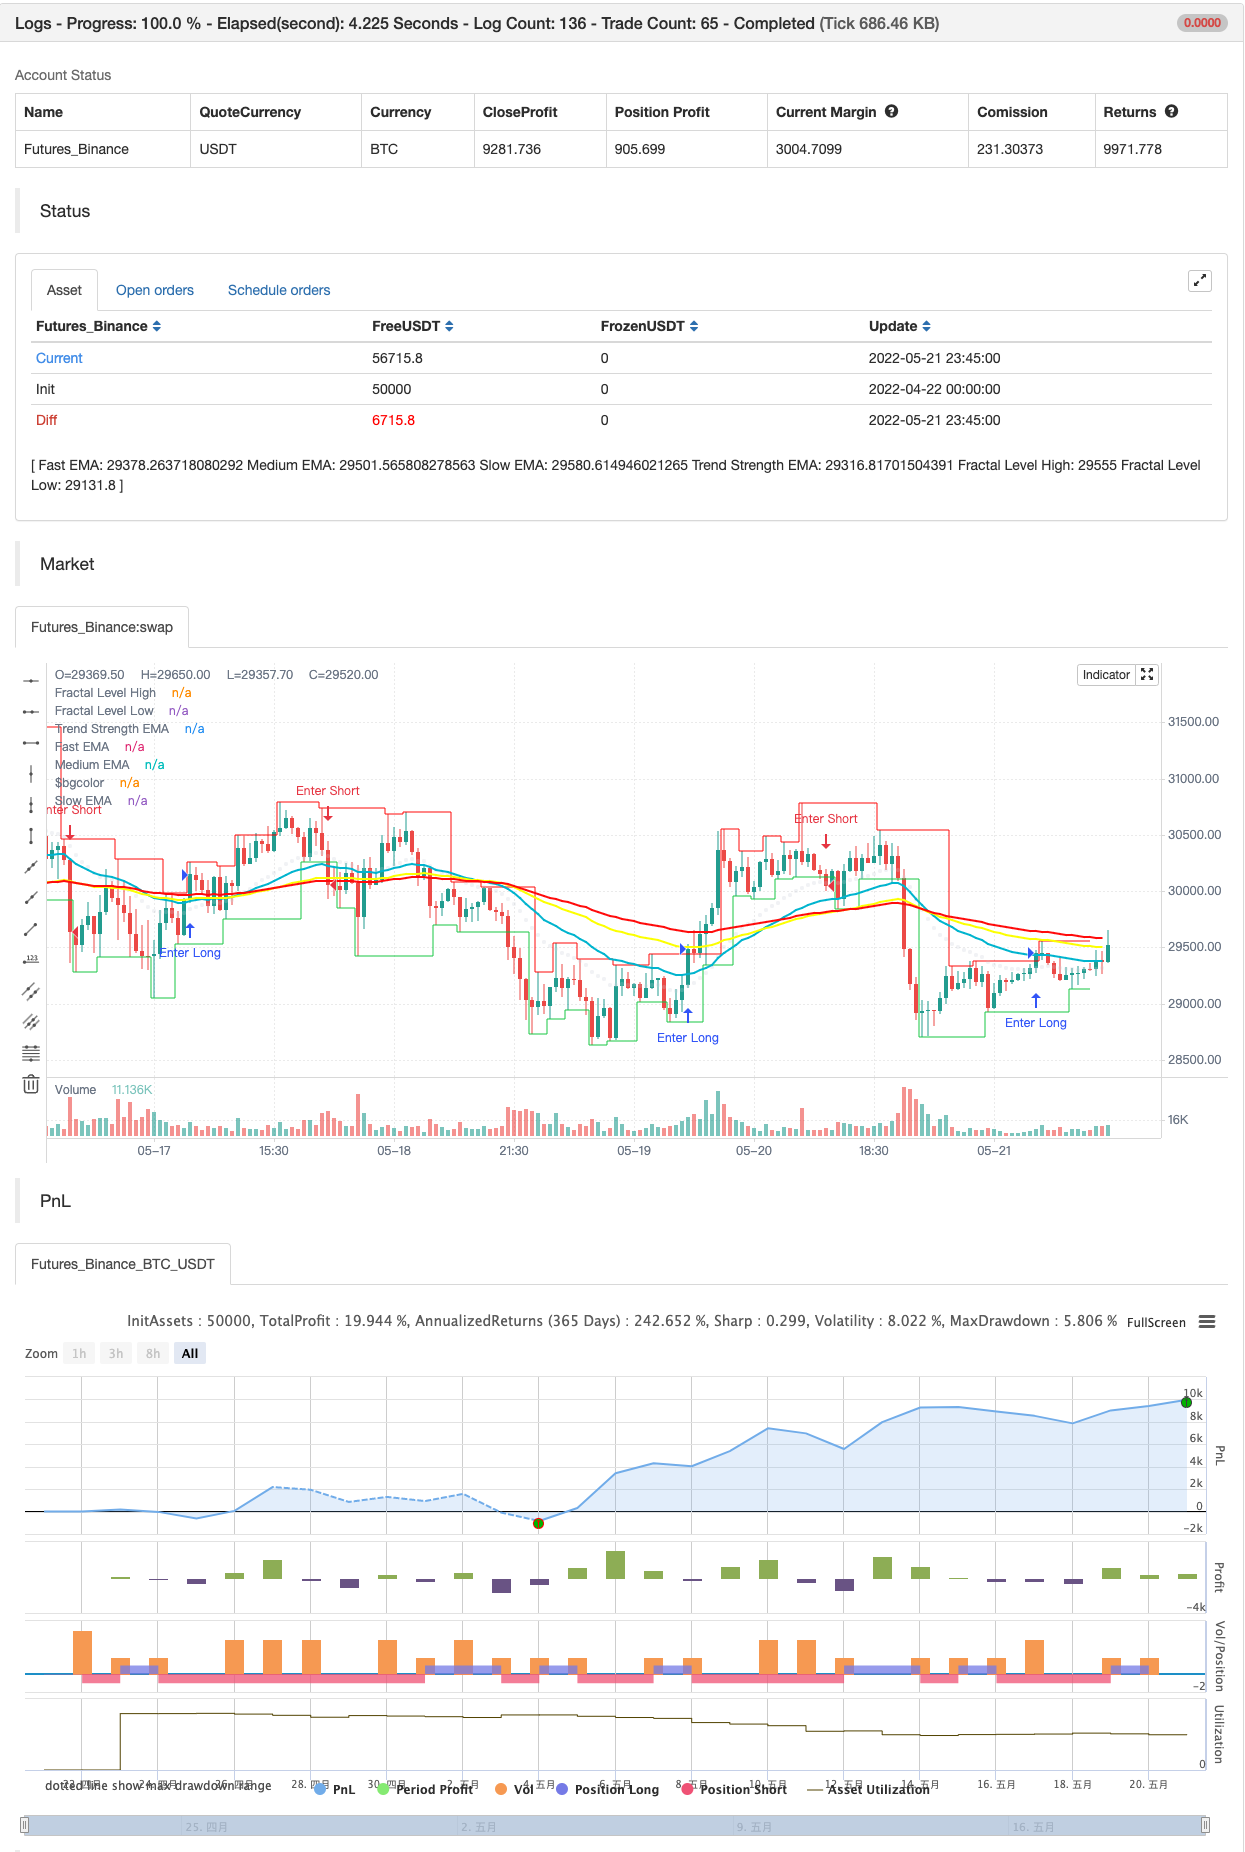
/*backtest
start: 2022-04-22 00:00:00
end: 2022-05-21 23:59:00
period: 45m
basePeriod: 5m
exchanges: [{"eid":"Futures_Binance","currency":"BTC_USDT"}]
*/

//@version=5

indicator('[VDB]TrendScalp-FractalBox-3EMA', shorttitle='[VDB]TS-FB-3EMA', overlay=true, max_lines_count=500)

// By: ©vireshdb/vdb/vdb007
//
//Description:
//          There are many indicators with William’s Fractal and Alligator. As many use EMA’s it may be useful to define an EMA ribbon and
//          combining Fractal levels/box (filling background between top and bottom fractals) for trend scalping. I searched for this kind of indicator in community – some show fractals,
//          some just levels, some with alligator etc.but couldn't find the one needed. Hence thought of this indicator which may be of interest to other users too.
//Key Points:
//          EMA ribbon is created using3 EMA’s 35/70/105. Users can change these as per their preference. This is used for trend identification –
//              1. Bullish bias if Price > EMA1 > EMA2 > EMA3. 2. Bearish bias if Price < EMA1 < EMA2 < EMA3.
//          Background is marked during crossing of EMA1 and EMA2 to alert possible change in trend.
//          5-bar fractals are used to mark the Fractal levels and backgrounds between top and bottom fractals are filled to create the Fractal Box.
//          Fractal levels are marked with offset 2 only when the fractal formation is complete and hence are lagging.
//How to Use:
//          Sloping EMA ribbon is used for identifying the trend.
//          Trend strength ema is enabled. Angle of 30degree and above is strength
//          Fractal box break-out/ break-downs are used to trigger the trade with fractal high/low for entry/stoploss.
//              - Waiting for price contraction towards EMA ribbon resulting in smaller boxes is key to initiate trade.
//              - Avoid bigger boxes as SL’s will be big and price may move within.
//              - To draw the vertical lines of FractalBox change fractal level0 style to stepline.
//          This indicator -
//              - Combined with the cycle/ banded indicators such as CCI/Stochastic/RSI etc can make it a good trend scalping setup
//              - While trading in the direction of momentum in higher timeframe.
// Reference : This indicator was achieved by combing some fractal ideas from "Fractal Framer by brobear"
//
// Copyright 2022 vireshdb
//
// This program is free software: you can redistribute it and/or modify
// it under the terms of the GNU General Public License as published by
// the Free Software Foundation, either version 3 of the License, or
// any later version.
//
// This program is distributed in the hope that it will be useful,
// but WITHOUT ANY WARRANTY; without even the implied warranty of
// MERCHANTABILITY or FITNESS FOR A PARTICULAR PURPOSE.  See the
// GNU General Public License for more details.
//
// The GNU General Public License can be found here
// <http://www.gnu.org/licenses/>.
//
// Start of code *************************************************************************************************

showema = input.bool(true, title='Show EMA Ribbon')
fastema = input.int(35, title='Fast EMA', minval=1)
medema = input.int(70, title='Medium EMA', minval=1)
slowema = input.int(105, title='Slow EMA', minval=1)
trstrema = input.int(20, title='Trend Strength EMA', minval=1)
EMA1 = ta.ema(close, fastema)
EMA2 = ta.ema(close, medema)
EMA3 = ta.ema(close, slowema)
TSEMA = ta.ema(close, trstrema)

plot(showema and fastema ? EMA1 : na, title='Fast EMA', color=color.new(#00bcd4, 0), linewidth=2)
plot(showema and medema ? EMA2 : na, title='Medium EMA', color=color.new(#fcff00, 0), linewidth=2)
plot(showema and slowema ? EMA3 : na, title='Slow EMA', color=color.new(#ff0909, 0), linewidth=2)
plot(showema and trstrema ? TSEMA : na, title='Trend Strength EMA', color=color.new(#d1d4dc, 75), linewidth=1, style=plot.style_circles)

bgcolor(color=ta.crossover(EMA1, EMA2) ? color.new(color.lime, 90) : ta.crossunder(EMA1, EMA2) ? color.new(color.red, 90) : na, title='Trend Marker')

// FRACTAL Levels and Box *******************************************************************************************
PlotFractLevel = input(defval=true, title='Show Fractal Levels and Box')
lnwidth = input.int(defval=1, title='Fractal Line Width', minval=1, maxval=3)

//----- Main ---------------------
fractLevelHigh = float(na)
fractLevelLow = float(na)
fractHigh = bool(na)
fractLow = bool(na)
lag = 0
lag := 2
fractHigh := high[4] <= high[2] and high[3] <= high[2] and high[2] > high[1] and high[2] > high ? true : false
fractLow := low[4] >= low[2] and low[3] >= low[2] and low[2] < low[1] and low[2] < low ? true : false

// Fractal levels
fractLevelHigh := fractHigh ? nz(high[lag], high) : nz(fractLevelHigh[1], high)
fractLevelLow := fractLow ? nz(low[lag], low) : nz(fractLevelLow[1], low)

//---- Plotting Fractal levels ---------------------
p1 = plot(PlotFractLevel ? fractLevelHigh : na, title='Fractal Level High', color=color.new(#ff0909, 0), linewidth=lnwidth, offset=-lag, style=plot.style_stepline)
p2 = plot(PlotFractLevel ? fractLevelLow : na, title='Fractal Level Low', color=color.new(#1bce4e, 0), linewidth=lnwidth, offset=-lag, style=plot.style_stepline)
fill(p1, p2, title='Fill Fractal Box', color=fractLevelHigh >= fractLevelLow ? color.new(#d1d4dc,90) : color.new(#fff59d, 90))

// Alert conditions
alertcondition(close > nz(fractLevelHigh, high), title='Above Fractal Level High', message='Fractal High Breakout')
alertcondition(close < nz(fractLevelLow, low), title='Below Fractal Level Low', message='Fractal Low Breakdown')

// End of FRACTAL Levels and Box ****************************************************************************************
// End of code***********************************************************************************************************

if close > nz(fractLevelHigh, high)
    strategy.entry("Enter Long", strategy.long)
else if close < nz(fractLevelLow, low)
    strategy.entry("Enter Short", strategy.short)
- MACDの金と死の交差値に基づいた取引戦略
- 強化されたボリンガー帯のRSI取引戦略
- トリプルEMAクロスオーバー戦略
- 指数関数移動平均のクロスオーバーレバレッジ戦略
- GM-8 と ADX の 双重 移動 平均 戦略
- RSI/MACD/ATRとの強化されたEMAクロスオーバー戦略
- Zスコア 戦略をフォローする傾向
- 長期入札は,EMAのリスク管理戦略と交差する
- VWAPの取引戦略
- WaveTrend クロス LazyBear 戦略
- AlphaTradingBotの取引戦略
- MACD 再充電戦略
- 超トレンド移動平均値
- ABC取引
- 15MIN BTCUSDTPERP BOT
- シャノンエントロピー V2
- 負荷が減る
- ボリュームフロー v3
- 暗号期貨は,ma & rsi - ogcheckersで毎時間スカルパー
- ATR スムーズ化
- オーダーブロックファインダー
- QQE信号
- U位格子振幅フィルタ
- CM MACD カスタム インディケーター - 複数のタイムフレーム - V2
- ホードルライン
- 2 移動平均色方向検知
- Scalping PullBack ツール R1
- 買・売戦略は AO+Stoch+RSI+ATRに依存する
- EMA トレンドクラウド
- RedK ボリューム加速方向エネルギー比
- ドンチアン・ブレイク 塗装なし