スーパートレンドV戦略


作成日: 2023-10-18 12:35:53 最終変更日: 2023-10-18 12:35:53
コピー: 0 クリック数: 877
1
フォロー
1617
フォロワー

スーパートレンドV戦略

概要

超トレンドV戦略は,移動平均と標準差に基づくショートライン取引戦略である.それは,移動平均が形成されたサポートと抵抗を組み合わせて,価格のトレンド方向を判断するために,スーパートレンド指標を使用し,入場を行う.同時に,それは,標準差チャネルを使用して,価格の潜在的サポートとレジスタンス領域を予測し,ストップ・ローズ・ストップの価格区間を設定し,トレンドフォローと効率的な退出を実現するショートライン取引戦略である.

戦略原則

この戦略はまず,スーパートレンド指数 (Super Trend indicator) を計算し,ATRと価格の関係を使ってトレンドの方向を判断する.価格が上昇傾向より高いときは看板,価格が下降傾向より低いときは看板である.

価格の移動平均EMAと開盤価格の移動平均EMAを計算し,価格が移動平均を上越し開盤価格平均線より高いときは買信として,価格が移動平均を下越し開盤価格平均線より低いときは売り信として使う.

次に,標準差を利用して価格チャネルの上下軌を計算し,平滑処理を行い,価格が標準差を突破すると上下軌は停止信号,価格が標準差を突破すると下下軌は停止信号となる.

最後に,異なる時間周期の移動平均を組み合わせてトレンドの方向を判断し,スーパートレンド指標と組み合わせて,安定したトレンド判断を形成する.

戦略的優位性

  • スーパートレンド指数は,価格の方向を判断し,トレンドの逆転を避けるために使用されます.
  • 移動平均は開盤価格と組み合わせて,入場タイミングを判断し,偽の突破を避ける
  • 標準差チャネル 価格の潜在的サポートとレジスタンス領域を予測し,ストップ・ストップ価格を設定する
  • 複数の時間周期を組み合わせてトレンドの方向を判断し,安定性を高める

戦略リスク

  • スーパートレンド指数は遅滞しており,トレンド転換点を見逃している可能性がある.
  • 移動平均は交差信号を生成し,入場タイミングが不適切である.
  • 標準差チャネルは,市場変動をリアルタイムで反映できないため,固定すぎます.
  • 複数の時間帯の判断が衝突する可能性がある

リスク対策:

  • Super Trendのパラメータを適切に縮小し,感受性を向上させる
  • 移動平均の周期を最適化したり,他の指標を加えたり
  • 標準差チャネルのパラメータを動的に調整して,市場に対応する範囲
  • 多周期判断の論理を明確に定義し,潜在的な衝突を処理する

戦略最適化の方向性

  • スーパートレンドのパラメータを最適化して,最適なパラメータの組み合わせを探します.
  • 移動平均と他の指標を組み合わせて,入場のタイミングを判断してみましょう.
  • 標準差チャネルのパラメータを動的に調整する
  • 複数の周期の組み合わせをテストし,最も適合する周期を特定します.
  • ストップ・ストップ・ストップ戦略を最適化して,戦略の利益の余地を増やす

要約する

超トレンドV戦略は,トレンド,均線,標準差通路などの指標の優位性を統合し,トレンドの方向を安定的に判断し,適切な入場時間を選択し,価格領域のストップストップのショートライン取引戦略を設定します.パラメータ最適化,指標最適化,ストップストップ最適化などの方面で改善することで,戦略の安定性と収益性を向上させることができます.その堅固な論理と厳格な思考方法は,学習と研究に値します.
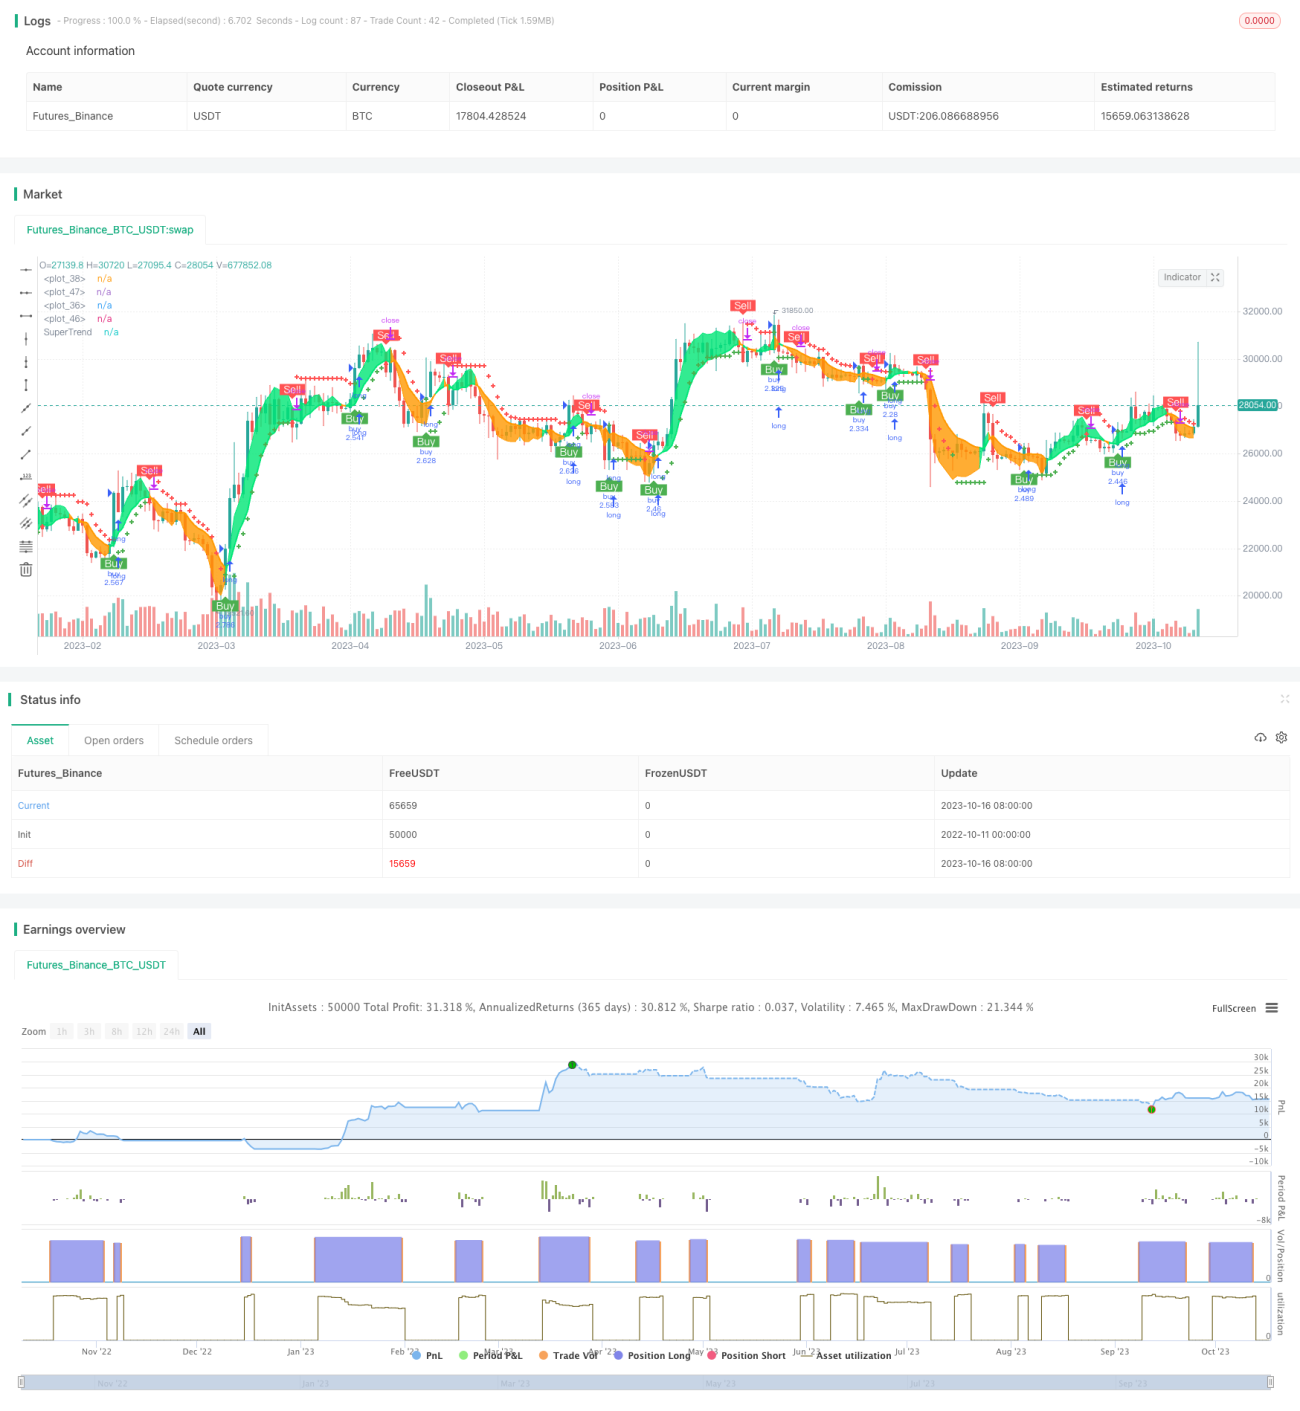
ストラテジーソースコード
/*backtest
start: 2022-10-11 00:00:00
end: 2023-10-17 00:00:00
period: 1d
basePeriod: 1h
exchanges: [{"eid":"Futures_Binance","currency":"BTC_USDT"}]
*/

// © theCrypster 2020

//@version=4
strategy(title = "Super trend V Strategy version", overlay = true, pyramiding=1,initial_capital = 1000, default_qty_type= strategy.percent_of_equity, default_qty_value = 100, calc_on_order_fills=false, slippage=0,commission_type=strategy.commission.percent,commission_value=0.075)
strat_dir_input = input(title="Strategy Direction", defval="long", options=["long", "short", "all"])
strat_dir_value = strat_dir_input == "long" ? strategy.direction.long : strat_dir_input == "short" ? strategy.direction.short : strategy.direction.all
strategy.risk.allow_entry_in(strat_dir_value)
hilow = ((high - low)*100)
openclose = ((close - open)*100)
vol = (volume / hilow)
spreadvol = (openclose * vol)
VPT = spreadvol + cum(spreadvol)
window_len = 28

v_len = 14
price_spread = stdev(high-low, window_len)

v =  spreadvol + cum(spreadvol)
smooth = sma(v, v_len)
v_spread = stdev(v - smooth, window_len)
shadow = (v - smooth) / v_spread * price_spread

out = shadow > 0 ? high + shadow : low + shadow
//
src = out
src1=open
src2=low
src3=high
tf =input(720)
len = timeframe.isintraday and timeframe.multiplier >= 1 ? 
   tf / timeframe.multiplier * 7 : 
   timeframe.isintraday and timeframe.multiplier < 60 ? 
   60 / timeframe.multiplier * 24 * 7 : 7

c = ema(src, len)
plot(c,color=color.red)
o = ema(src1,len)
plot(o,color=color.blue)
//h = ema(src3,len)
//l=ema(src2,len)
//
col=c > o? color.lime : color.orange
vis = true
vl = c
ll = o
m1 = plot(vl, color=col, linewidth=1, transp=60)
m2 = plot(vis ? ll : na,  color=col, linewidth=2, transp=80)

fill(m1, m2,  color=col, transp=70)
//

vpt=ema(out,len)

// INPUTS //
st_mult   = input(1,   title = 'SuperTrend Multiplier', minval = 0, maxval = 100, step = 0.01)
st_period = input(10, title = 'SuperTrend Period',     minval = 1)

// CALCULATIONS //
up_lev = vpt - (st_mult * atr(st_period))
dn_lev = vpt + (st_mult * atr(st_period))

up_trend   = 0.0
up_trend   := close[1] > up_trend[1]   ? max(up_lev, up_trend[1])   : up_lev

down_trend = 0.0
down_trend := close[1] < down_trend[1] ? min(dn_lev, down_trend[1]) : dn_lev

// Calculate trend var
trend = 0
trend := close > down_trend[1] ? 1: close < up_trend[1] ? -1 : nz(trend[1], 1)

// Calculate SuperTrend Line
st_line = trend ==1 ? up_trend : down_trend

// Plotting
plot(st_line[1], color = trend == 1 ? color.green : color.red , style = plot.style_cross, linewidth = 2, title = "SuperTrend")
buy=crossover( close, st_line) and close>o
sell=crossunder(close, st_line) and close<o
//plotshape(crossover( close, st_line), location = location.belowbar, color = color.green,size=size.tiny)
//plotshape(crossunder(close, st_line), location = location.abovebar, color = color.red,size=size.tiny)
plotshape(buy, title="buy", text="Buy", color=color.green, style=shape.labelup, location=location.belowbar, size=size.small, textcolor=color.white, transp=0)  //plot for buy icon
plotshape(sell, title="sell", text="Sell", color=color.red, style=shape.labeldown, location=location.abovebar, size=size.small, textcolor=color.white, transp=0)  //plot for sell icon


//
multiplier = input(title="TP VWAP Deviation", type=input.float, defval=2, minval=1)
src5 = vwap
len5 = input(title="TP length", defval=150, minval=1)
offset = 0

calcSlope(src5, len5) =>
    sumX = 0.0
    sumY = 0.0
    sumXSqr = 0.0
    sumXY = 0.0
    for i = 1 to len5
        val = src5[len5-i]
        per = i + 1.0
        sumX := sumX + per
        sumY := sumY + val
        sumXSqr := sumXSqr + per * per
        sumXY := sumXY + val * per
        
        
    slope = (len5 * sumXY - sumX * sumY) / (len5 * sumXSqr - sumX * sumX)
    average = sumY / len5
    intercept = average - slope * sumX / len5 + slope
    [slope, average, intercept]

var float tmp = na
[s, a, i] = calcSlope(src5, len5)

vwap1=(i + s * (len5 - offset))
sdev = stdev(vwap, len5)
dev = multiplier * sdev
top=vwap1+dev
bott=vwap1-dev

//
z1 = vwap1 + dev
x1 = vwap1 - dev

low1 = crossover(close, x1)  
high1 = crossunder(close, z1) 

plotshape(low1, title="low", text="TP", color=color.red, style=shape.labelup, location=location.belowbar, size=size.small, textcolor=color.white, transp=0)  //plot for buy icon
plotshape(high1, title="high", text="TP", color=color.green, style=shape.labeldown, location=location.abovebar, size=size.small, textcolor=color.white, transp=0)  //plot for sell icon


//
// Testing Start dates
testStartYear = input(2016, "Backtest Start Year")
testStartMonth = input(1, "Backtest Start Month")
testStartDay = input(1, "Backtest Start Day")
testPeriodStart = timestamp(testStartYear,testStartMonth,testStartDay,0,0)
//Stop date if you want to use a specific range of dates
testStopYear = input(2030, "Backtest Stop Year")
testStopMonth = input(12, "Backtest Stop Month")
testStopDay = input(30, "Backtest Stop Day")
testPeriodStop = timestamp(testStopYear,testStopMonth,testStopDay,0,0)


testPeriod() =>
    time >= testPeriodStart and time <= testPeriodStop ? true : false

l = buy
s1 = sell
        
if l and testPeriod()
    strategy.entry("buy", strategy.long)
if s1 and testPeriod()
    strategy.entry("sell", strategy.short)