RSI MACD クロスオーバー ダブル移動平均追跡戦略

概要
この戦略は,RSI指標,MACD指標および双均線を総合的に使用して,トレンド追跡および定位標準差の市場状況の効果を実現します.戦略は,RSI指標によって,超買い超売り現象を判断し,MACDは,快慢均線の交差を判断し,買い出品のタイミングを判断し,双均線は,一部のノイズ取引機会をフィルターして,トレンドで利益を得ます.
戦略原則
- RSIの指標を計算して 超買いと超売りを判断する
-
周期内での変動を計算する
-
RSIは,上昇と上昇による変化によって計算されます.
-
超買いと超売りの判断
- MACD指数判断の交差を計算する
-
速線,遅線,信号線を計算する
-
横断的な買い物と売買の実現
-
交差点を表示する
- 双均線フィルタリングを実現
-
速線と遅線を計算する
-
速線で遅線を走る時だけ取引を考える
-
トレンドトラッキングのノイズフィルター
- 複数の指標を組み合わせて入場を判断
-
総合RSI,MACD,双均線多重条件フィルタリング
-
戦略の安定性を高める
優位分析
-
複数の指標の組み合わせで戦略の正確さを向上させる
-
トレンドトラッキング,ノイズフィルター,安定性
-
RSIは過買過売を判断し,転換点を捉えるのに役立ちます
-
MACDのクロス判断は,簡単に,効率的に,買ったり売ったりする判断をします.
-
双方向のフィルタリングにより,非主流の取引機会のほとんどは削除されます.
-
簡単な理解,パラメータが少ない,初心者の学習改善に適しています.
リスク分析
-
複数の指標の組み合わせで,戦略の過度最適化が起こりやすい
-
双方向は柔軟性を犠牲にして,機会を逃している
-
RSIとMACDのパラメータは慎重に選択する必要があります.
-
取引品のストップ・ローズに注目し,リスクをコントロールする
-
長期使用は,市場に対応するためにパラメータを繰り返し調整する必要があります.
最適化の方向
-
RSIパラメータを異なる品種特性に合わせて調整する
-
双均線周期を調整し,トレンド追跡効果を最適化する
-
単一損失をコントロールするストップ・ローズ戦略
-
富裕な条件の組み合わせ
-
開発パラメータの自己適応モード,パラメータの自動調整
要約する
この戦略は,RSI,MACD,双均線などの複数の指標を総合的に使用し,トレンドの判断と追跡を実現し,機会の複数のフィルタリングを行う.これは,学習と改善の初心者にとても適した多指標戦略である.この戦略の優点は,単純で効率的で,容易に理解できる適応であり,パラメータを調整することで良い安定した収益を得ることができる.次のステップは,より多くの指標を追加し,パラメータを適応するモデルなどのさらなる最適化戦略を開発し,より多くの異なる市場環境に自動的に適応できるようにすることができる.
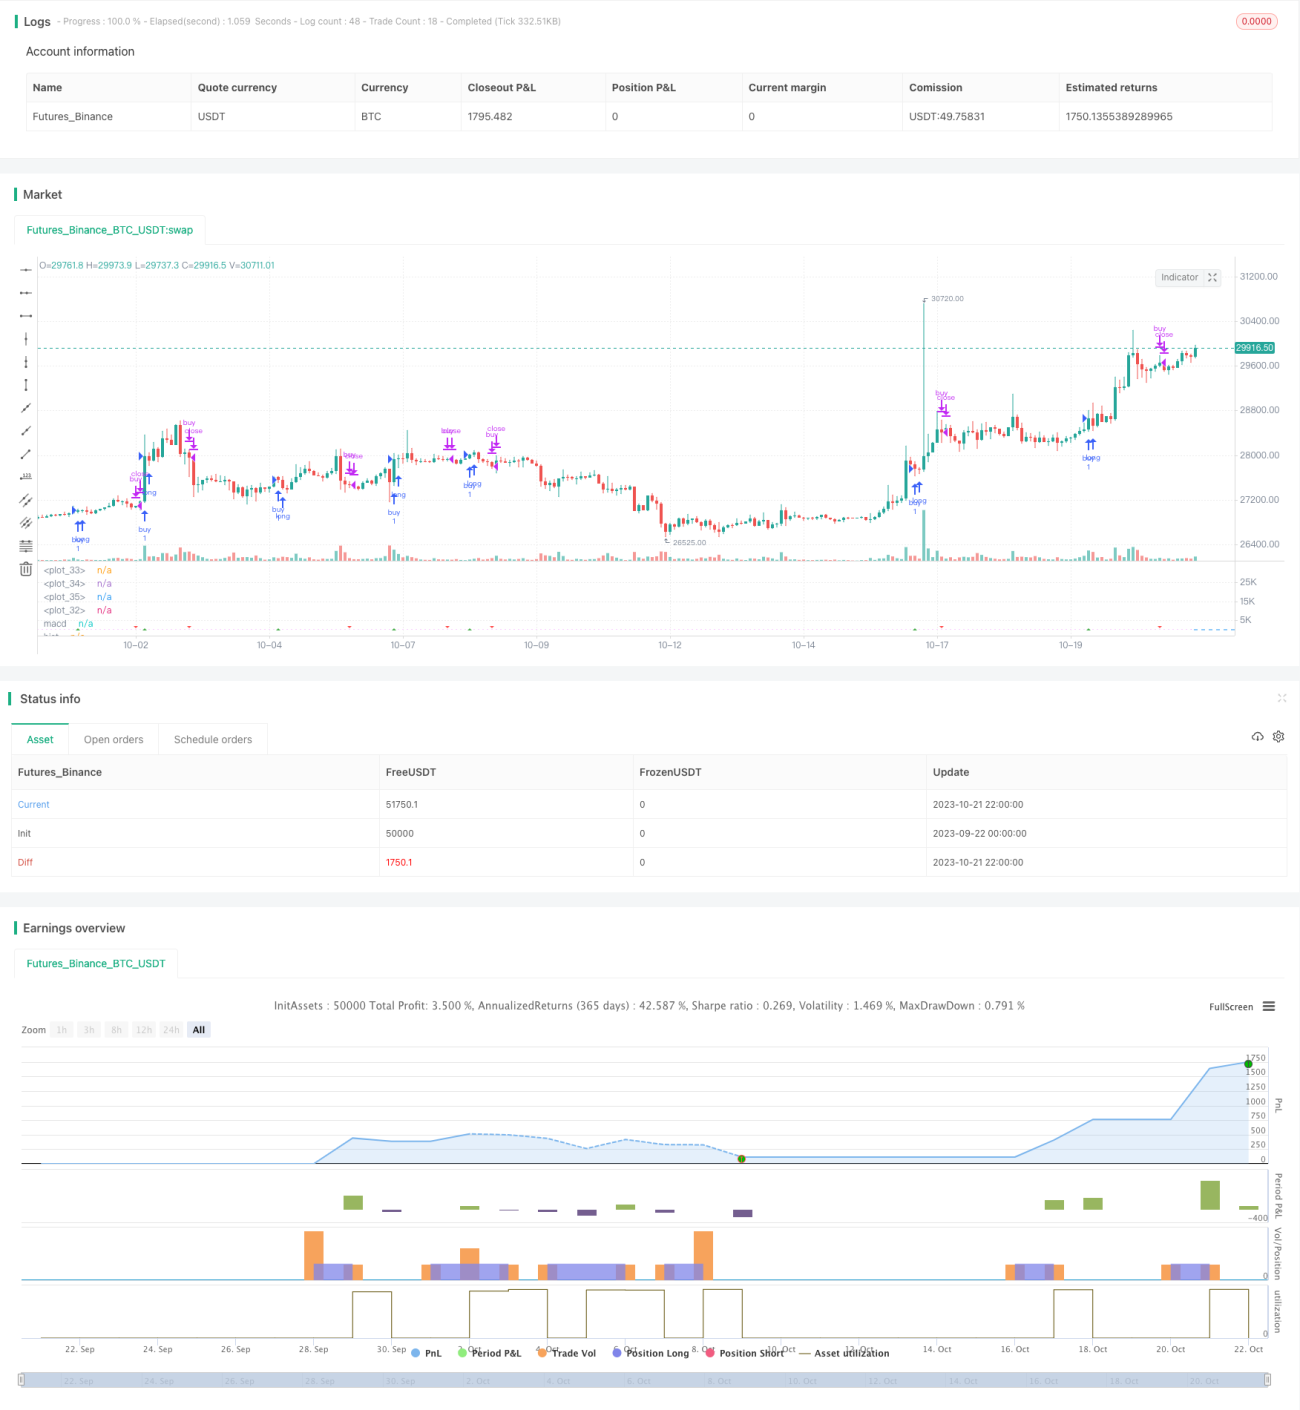
/*backtest
start: 2023-09-22 00:00:00
end: 2023-10-22 00:00:00
period: 2h
basePeriod: 15m
exchanges: [{"eid":"Futures_Binance","currency":"BTC_USDT"}]
*/

//@version=3

// strategy(title="RSI MACD", precision = 6, pyramiding = 1, default_qty_type = strategy.percent_of_equity, default_qty_value = 99, commission_type = strategy.commission.percent, commission_value = 0.25, initial_capital = 1000)
- 1