モメンタムアービトラージ戦略のバックテスト分析


作成日: 2023-10-25 11:10:59 最終変更日: 2023-10-25 11:10:59
コピー: 0 クリック数: 728
1
フォロー
1617
フォロワー

モメンタムアービトラージ戦略のバックテスト分析

1. 戦略の名称

この戦略の主な特徴を踏まえ,私はこれを動量アベरेज戦略 (動量アベरेज戦略) と命名する.

2 戦略概要

この戦略は,Chandeの動力振動指標を計算し,上下値を設定して多空信号を構築し,ブレーキの機会を形成し,利益を上げます.

3つ目 戦略の原則

まず,Length,TopBand,LowBandのパラメータを設定し,Lengthは計算動力の日数周期を表し,TopBandとLowBandは設定された上下値を表します.

次に,最近のLengthdayの絶対移動量xMomを計算し,次に,xMomのLengthdayの単純移動平均xSMA_momを計算する.

続いて,Length の1日間の累積動量xMomLength を計算する.

次に,運動振動指数nResを計算し,xMomLengthをxSMA_momで割ってLengthを倍し,100倍拡大する.

nResと上下値の大きさの関係によって多空方向を判断し,posに貯蔵する.

最後に,反転取引の修正posが有効であるかどうかに基づいて,取引信号possigを生成し,多空エントリーを生成する.

4 戦略的優位性

  1. 動態指標を使用して,トレンドの潜在的転換点を認識し,トレンドを捉えることができます.
  2. 値フィルターと組み合わせて明確な多空信号を形成し,誤った取引を避ける
  3. 逆転取引のアイデアを活用して,逆転の機会を得ることができます.
  4. パラメータは空間的に調整され,異なる品種,周期に最適化できます.
  5. パラメータを視覚化して,取引ロジックを理解する

5 戦略的リスク

  1. 動力要因のみを考慮すると,他の技術指標がもたらす取引機会が失われる可能性があります.
  2. 動力の突破は必ずしもトレンドの転換を意味するものではなく,誤判の危険性がある.
  3. 逆転取引は利得の余地があるが,損失を増やす可能性もある.
  4. パラメータの不適切な最適化は,取引頻度が高くなり,最適なポイントを逃す可能性があります.
  5. 突発的な事件による短期的な動力変異を適切にフィルターする必要がある

トレンド,波動率などの他の技術指標を組み合わせて,動量シグナルの信頼性を決定し,パラメータを調整し,取引頻度を低下させ,ストップ・ロース・ポイントを適切に緩和して,リスクを制御することができます.

6 戦略の最適化方向

  1. 他の技術指標のフィルタリングを加え,取引信号の正確性を向上させる

動量シグナルが触発される前に,閉盘価格が均線システムの上にあるか,または変動率が正常な範囲にあるか判断することができる.

  1. 品種特性による最適化パラメータ

波動率が高い品種は,波動量波動の正常値範囲を適切に広げ,取引頻度を低下させることができる.

  1. 異なるタイムサイクルによる複数のタイムフレームの最適化

日中により小さな周期Lengthを採用し,超ショートライン取引を行う.周線または月線に従ってパラメータを調整し,中長線傾向に焦点を当てます.

  1. 条件を背けた底を設定する

ポジティブな信号が発せられたとき,前波谷より高い価格の条件を加えて,トレンドの逆転の偽信号を避ける必要があります.

VII. 結論

この戦略は,主に動量指標によって短期トレンド反転の機会を識別し,パラメータフィルタリングと組み合わせて取引シグナルを生成し,トレンド追跡と反転キャプチャの両方を兼ね,リスクは制御可能です.複数のタイムフレームを最適化し,他の技術指標を組み合わせることで,戦略取引の効果を向上させることができ,さらなる研究と応用に値します.
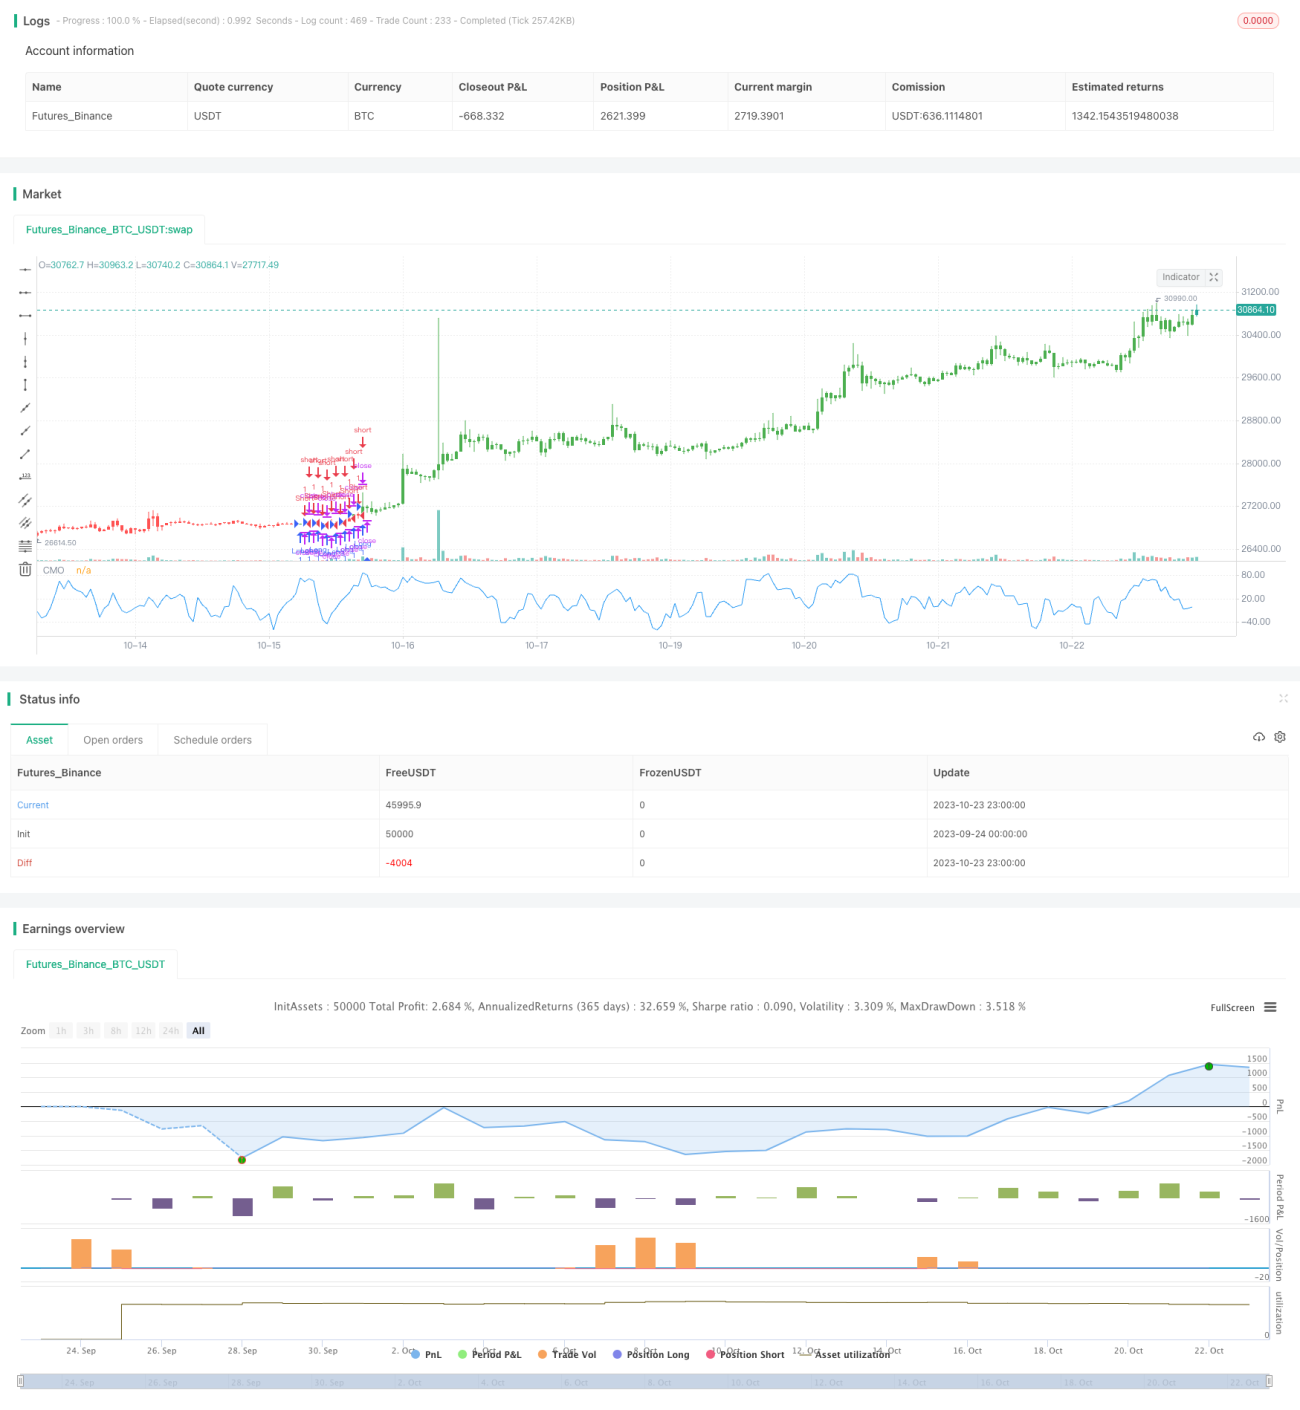
ストラテジーソースコード
/*backtest
start: 2023-09-24 00:00:00
end: 2023-10-24 00:00:00
period: 1h
basePeriod: 15m
exchanges: [{"eid":"Futures_Binance","currency":"BTC_USDT"}]
*/

//@version=2
////////////////////////////////////////////////////////////
//  Copyright by HPotter v1.0 07/02/2017
//    This indicator plots Chande Momentum Oscillator. This indicator was 
//    developed by Tushar Chande. A scientist, an inventor, and a respected 
//    trading system developer, Mr. Chande developed the CMO to capture what 
//    he calls "pure momentum". For more definitive information on the CMO and 
//    other indicators we recommend the book The New Technical Trader by Tushar 
//    Chande and Stanley Kroll.
//    The CMO is closely related to, yet unique from, other momentum oriented 
//    indicators such as Relative Strength Index, Stochastic, Rate-of-Change, 
//    etc. It is most closely related to Welles Wilder`s RSI, yet it differs 
//    in several ways:
//        - It uses data for both up days and down days in the numerator, thereby 
//          directly measuring momentum;
//        - The calculations are applied on unsmoothed data. Therefore, short-term 
//          extreme movements in price are not hidden. Once calculated, smoothing 
//          can be applied to the CMO, if desired;
//        - The scale is bounded between +100 and -100, thereby allowing you to 
//          clearly see changes in net momentum using the 0 level. The bounded scale 
//          also allows you to conveniently compare values across different securities.
////////////////////////////////////////////////////////////
strategy(title="CMO (Chande Momentum Oscillator)", shorttitle="CMO")
Length = input(9, minval=1)
TopBand = input(70, minval=1)
LowBand = input(-70, maxval=-1)
reverse = input(false, title="Trade reverse")
// hline(0, color=gray, linestyle=dashed)
// hline(TopBand, color=red, linestyle=line)
// hline(LowBand, color=green, linestyle=line)
xMom = abs(close - close[1])
xSMA_mom = sma(xMom, Length)
xMomLength = close - close[Length]
nRes = 100 * (xMomLength / (xSMA_mom * Length))
pos = iff(nRes > TopBand, 1,
	   iff(nRes <= LowBand, -1, nz(pos[1], 0))) 
possig = iff(reverse and pos == 1, -1,
         iff(reverse and pos == -1, 1, pos))	   
if (possig == 1) 
    strategy.entry("Long", strategy.long)
if (possig == -1)
    strategy.entry("Short", strategy.short)	   	    
barcolor(possig == -1 ? red: possig == 1 ? green : blue)
plot(nRes, color=blue, title="CMO")