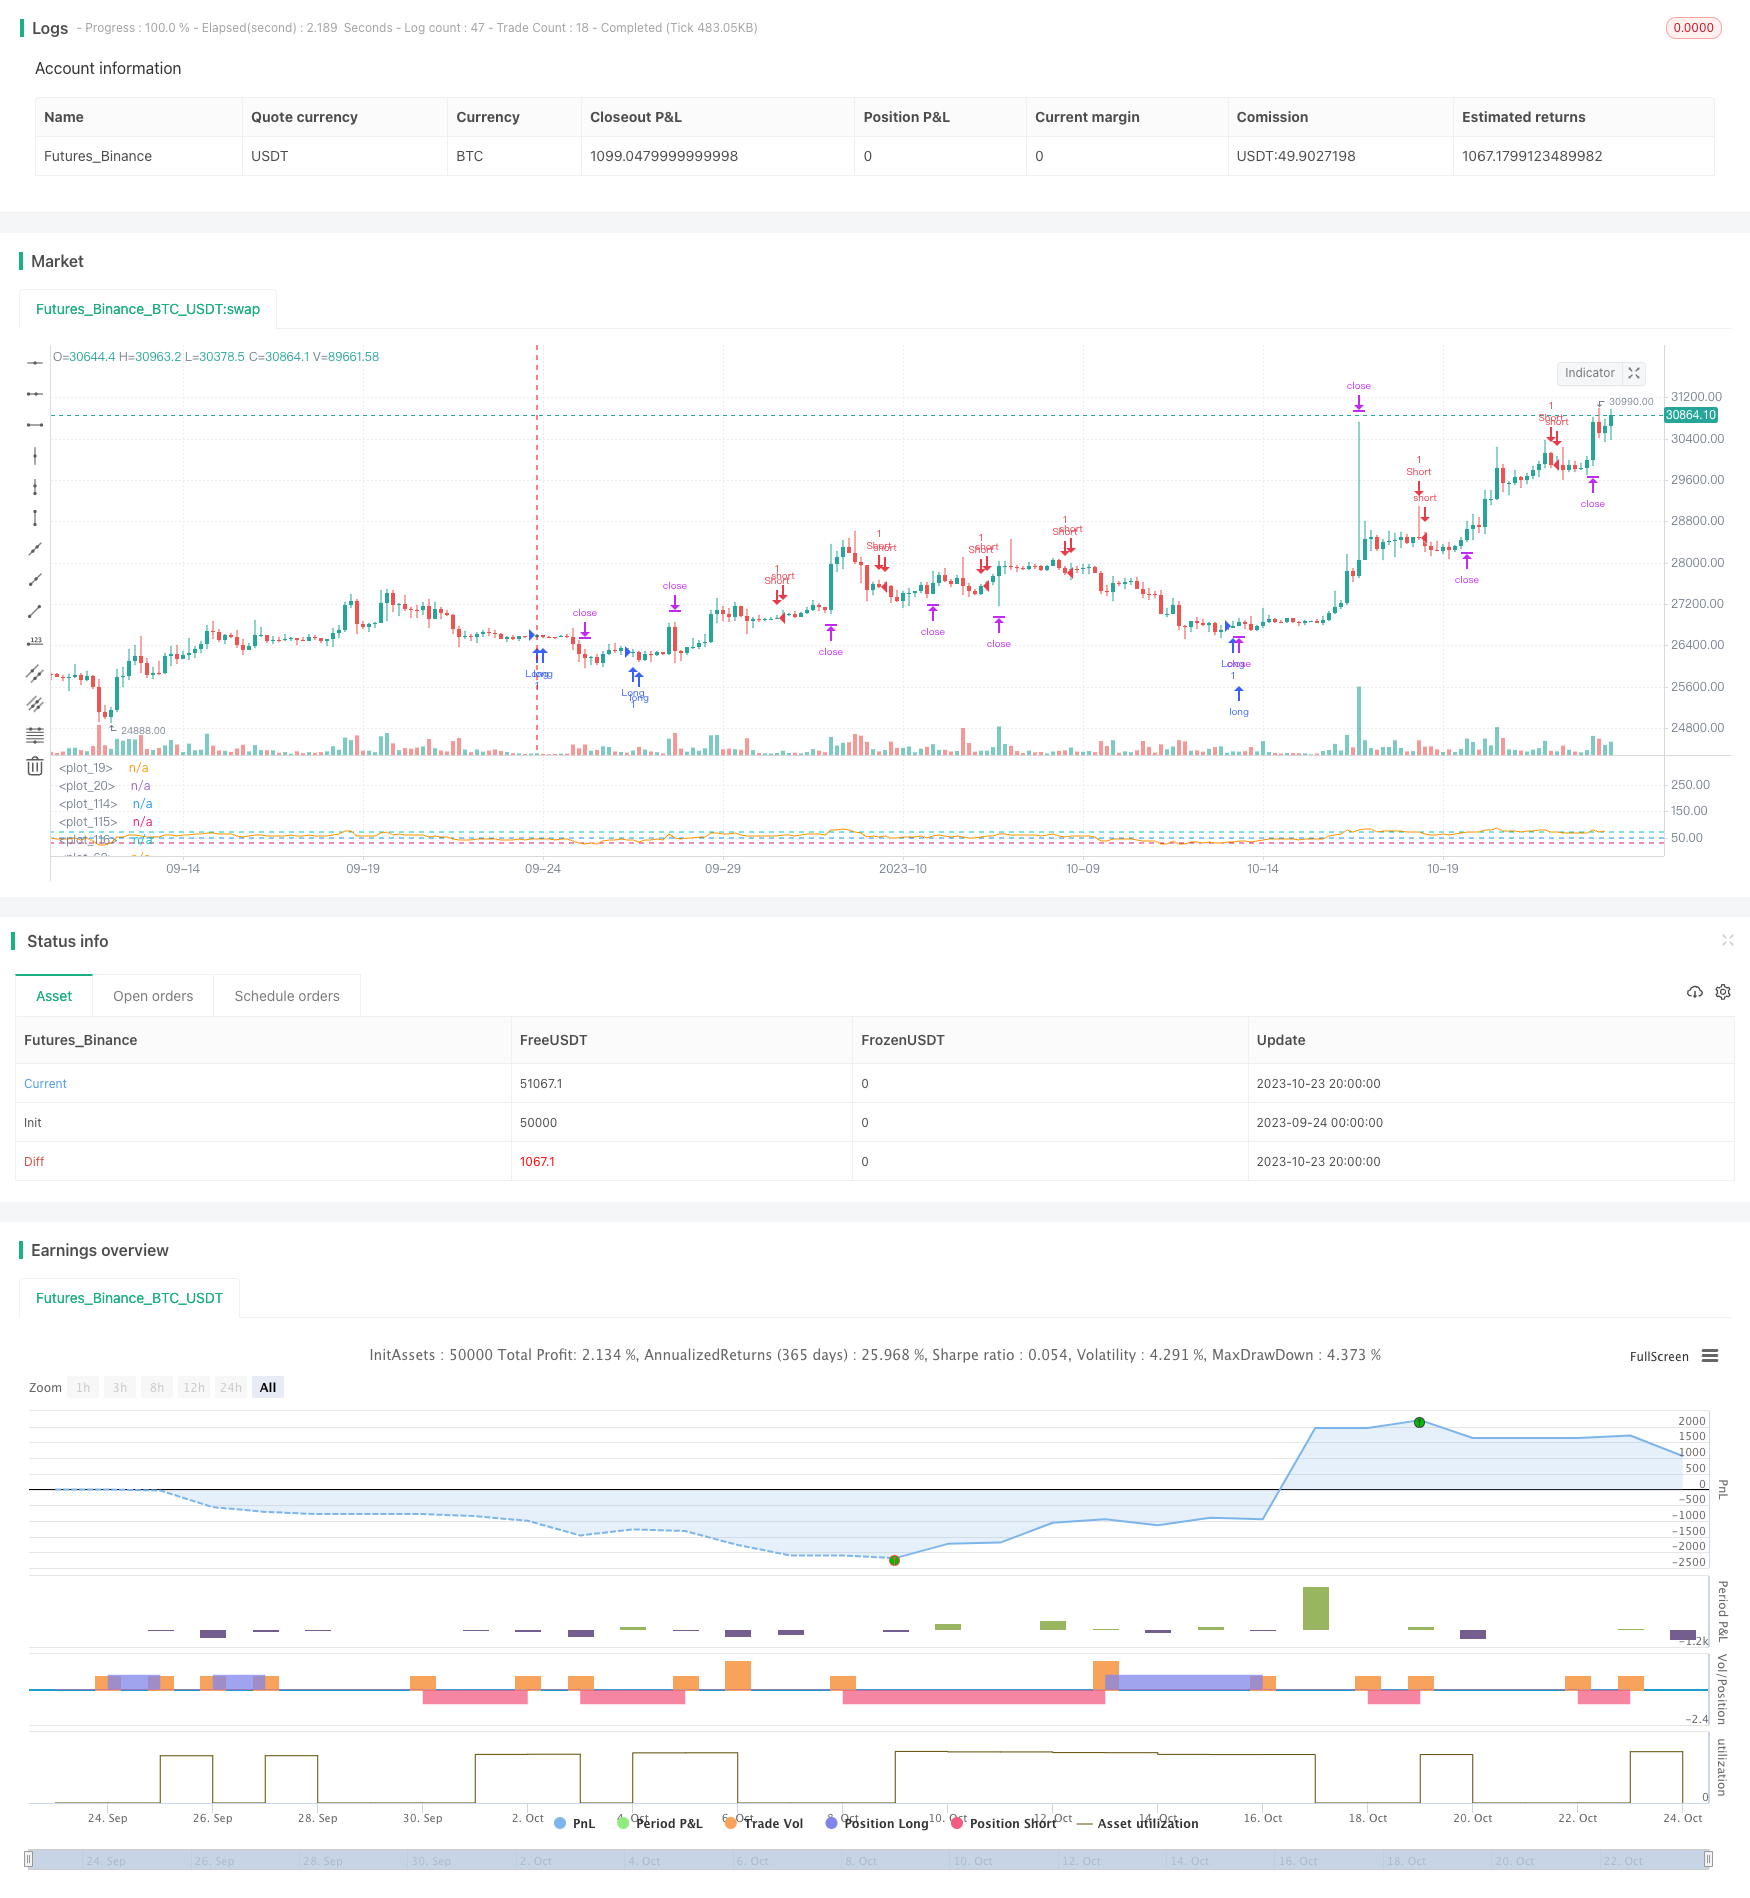
RSIダイバージェンス取引戦略

概要
RSI指数と価格の動きの間の偏差を認識して,買入と売却のシグナルを与える. この戦略は,停止,停止,停止の追跡などの機能を同時に備えており,リスクを効果的に制御できます.
原則
この戦略は,主にRSI指標の背離に基づいて取引機会を識別する.具体的には,戦略は,まず一定の周期内のRSI値を計算し,その後RSI指標のトレンドラインを描きます.同時に,戦略は価格のトレンドラインも描きます.RSIラインと価格ラインとの背離が発生したとき,すなわちRSIが上昇して価格が下がり,またはRSIが低下して価格が上昇すると,戦略判断は,反転が起こり,取引信号を生成します.
RSI線が低点から上昇し,価格線が高点から下落する状況が認識されれば,買入シグナルを与えます.RSI線が高点から下落し,価格線が低点から上昇する状況が認識されれば,売出シグナルを与えます.取引シグナルが形成されると,戦略はRSI値の大きさに応じて適量取引することができます.
さらに,ストップ・ロズ,ストップ・ストップ,ストップ・トラッキング機能も設定されている. ストップ・ロスは損失のリスクを制御し,ストップ・ストップは利益をロックし,ストップ・ロスは利益を継続させることができる. これらの設定は,各取引のリスクを効果的に管理することができます.
利点
RSIから外れた取引戦略は以下の利点があります.
RSIの偏差を捉えることで,価格の転換を早期に発見できます.
RSI指標は広く使用され,ほとんどの取引ソフトウェアはRSI指標を内蔵している.この戦略は適用性がある.
RSI指標のパラメータは,市場の観察周期に応じて柔軟に設定され,異なる状況に適応することができます.
ストップ・ストップ・ストップとストップ・ストップ・トラッキングの組み合わせにより,各取引のリスクを効果的に制御できます.
策略 交易信号の頻度は適度で,過剰に密集した取引を避ける
戦略は明確で分かりやすく,コンピュータプログラムで簡単に実行できます.
リスク
この戦略にはいくつかのリスクがあります.
RSIの偏差は100%信頼できないので,偽信号が発生する可能性があります.他の指標のフィルター信号と組み合わせる必要があります.
RSIは,トレンドの状況では,信号から外れると効き目なくなり,使用は避けるべきです.
RSIパラメータの不適切な設定は,戦略の効果にも影響する.周期が短すぎると,取引頻度とリスクが増加する.
止損ポイントが小さすぎると,早期止損が起こりうる.止損ポイントが大きすぎると,リスクを効果的に制御できない.バランス設定が必要である.
追跡ストップは,価格が激変するときに,早めにストップすることがあります.市場変動率と組み合わせて合理的な追跡ストップ距離を設定する必要があります.
リスクは以下の方法で軽減できます.
MACD,ブリンラインなどの他の指標を追加して信号フィルタリングを行い,偽信号を減らす.
この策略は,明らかにトレンドの動きを避けるために,揺れ動いている市を集計する時にのみ使用します.
RSIのパラメータ設定を最適化し,最適な周期長さを選択します. 同時に,異なる市場のパラメータの好みをテストします.
歴史的回測データに基づいて合理的な停止と停止位置を設定する.
市場変動とリスクの好みに応じてストップの幅を調整する.
最適化の方向
この戦略は以下の点で最適化できます.
取引信号をフィルタリングする他の指標の判断を追加し,信号の信頼性を高めます.
RSIパラメータの設定を自動最適化するために,機械学習技術を使用します.
異なる市場情勢のパターンに応じて,ダイナミックなストップ・ロズ・アルゴリズムを設計する.例えば,震動情勢の際にストップ・ロズを拡大し,トレンド情勢の際にストップ・ロズを縮小する.
ダイナミックなポジション管理アルゴリズムを設計し,市場の変動率などの要因に応じて,取引毎のポジションのサイズを調整する.
追跡ストップに波動率の概念を導入し,価格の波動の強さに応じて追跡ストップ距離を設定する.
外国為替や仮想通貨などの他の市場にも戦略を展開する.
戦略的な取引の自動化のための量化取引システムを構築する.
要約する
このRSI偏差取引戦略は,RSI指標と価格動きの間の偏差を捕捉して取引信号を生成する.戦略の優点は,シンプルで明快で,自動化が容易である.同時に,ストップ・ロス,ストップ・ストップ,ストップ・ロスを追跡する設定も,リスクを効果的に制御する.しかし,戦略にはいくつかの制限があり,複数の指標の組み合わせで信号を検証する必要があり,強いトレンドの状況には適用されない.戦略は,パラメータの設定を最適化,信号の過差を増加させ,動的ストップなどの面で改善することができる.
/*backtest
start: 2023-09-24 00:00:00
end: 2023-10-24 00:00:00
period: 4h
basePeriod: 15m
exchanges: [{"eid":"Futures_Binance","currency":"BTC_USDT"}]
*/

// This source code is subject to the terms of the Mozilla Public License 2.0 at https://mozilla.org/MPL/2.0/
// © faytterro

//@version=5
// strategy("RSI Divergence Strategy", overlay=true, scale = scale.none)
rsilen=input.int(14, title="rsi length")
rsisrc=input(close, title="source")
x=ta.rsi(rsisrc,rsilen)
len=input.int(14, title="RSI Divergence length", maxval=500)
tpb = input.float(25, title="take profit", group = "buy", step = 0.5)
sb = input.float(5, title="stop", group = "buy", step = 0.5)
tsb = input.float(0.25, title="trailing stop", group = "buy", step = 0.5)
tps = input.float(25, title="take profit", group = "sell", step = 0.5)
ss =input.float(5, title="stop", group = "sell", step = 0.5)
tss = input.float(0.25, title="trailing stop", group = "sell", step = 0.5)
src=close
extrapolation=0
zoom=input.int(0, title="zoom", maxval=27, minval=-27)
hline(300-zoom*10, color=color.rgb(54, 58, 69, 100))
hline(10, color=color.rgb(54, 58, 69, 100))
// for ax+b
xo=0.0
yo=0.0
xyo=0.0
xxo=0.0
for i=0 to len-1
    xo:= xo + i/(len)
    yo:= yo + x[len-1-i]/(len)
    xyo:= xyo + i*x[len-1-i]/(len)
    xxo:= xxo + i*i/(len)
dnm=ta.lowest(low,200)
dizi=array.new_float(len*2+1+extrapolation)
// linedizi=array.new_line()
a=(xo*yo-xyo)/(xo*xo-xxo)
b=yo-a*xo
for i=0 to len-1+extrapolation
    array.set(dizi,i,a*i+b)
//// for src
// for ax+b
xo2=0.0
yo2=0.0
xyo2=0.0
xxo2=0.0
for i=0 to len-1
    xo2:= xo2 + i/(len)
    yo2:= yo2 + src[len-1-i]/(len)
    xyo2:= xyo2 + i*src[len-1-i]/(len)
    xxo2:= xxo2 + i*i/(len)

dizi2=array.new_float(len*2+1+extrapolation)
// linedizi2=array.new_line()
a2=(xo2*yo2-xyo2)/(xo2*xo2-xxo2)
b2=yo2-a*xo2
for i=0 to len-1+extrapolation
    array.set(dizi2,i,a2*i+b2)
ttk=((array.get(dizi,0)<array.get(dizi,1)) and (array.get(dizi2,0)>array.get(dizi2,1)))? 1 :
 ((array.get(dizi,0)>array.get(dizi,1)) and (array.get(dizi2,0)<array.get(dizi2,1)))? -1 : 0
cg=((array.get(dizi,0)<array.get(dizi,1)) and (array.get(dizi2,0)>array.get(dizi2,1)))// and ta.highest(ttk[1],len/2)<1)
cr=((array.get(dizi,0)>array.get(dizi,1)) and (array.get(dizi2,0)<array.get(dizi2,1)))// and ta.lowest(ttk[1],len/2)>-1)
bgcolor(color=(cg and ta.highest(ttk[1],len/2)<1)? color.rgb(76, 175, 79, 50) :
 (cr and ta.lowest(ttk[1],len/2)>-1)? color.rgb(255, 82, 82, 50) : na, offset=0, display=display.none)
plot(x)

// for ax+b
xo3=0.0
yo3=0.0
xyo3=0.0
xxo3=0.0
for i=0 to len-1
    xo3:= xo3 + i/(len)
    yo3:= yo3 + x[len-1-i+(ta.barssince(cg))]/(len)
    xyo3:= xyo3 + i*x[len-1-i+(ta.barssince(cg))]/(len)
    xxo3:= xxo3 + i*i/(len)

dizi3=array.new_float(len*2+1+extrapolation)
// linedizi3=array.new_line()
a3=(xo3*yo3-xyo3)/(xo3*xo3-xxo3)
b3=yo3-a3*xo3
for i=0 to len-1+extrapolation
    array.set(dizi3,i,a3*i+b3)

// for ax+b
xo4=0.0
yo4=0.0
xyo4=0.0
xxo4=0.0
for i=0 to len-1
    xo4:= xo4 + i/(len)
    yo4:= yo4 + x[len-1-i+(ta.barssince(cr))]/(len)
    xyo4:= xyo4 + i*x[len-1-i+(ta.barssince(cr))]/(len)
    xxo4:= xxo4 + i*i/(len)

dizi4=array.new_float(len*2+1+extrapolation)
// linedizi4=array.new_line()
a4=(xo4*yo4-xyo4)/(xo4*xo4-xxo4)
b4=yo4-a4*xo4
for i=0 to len-1+extrapolation
    array.set(dizi4,i,a4*i+b4)

// line=line.new((last_bar_index-ta.barssince(cg)-len),
//  array.get(dizi3,0),
//  last_bar_index-ta.barssince(cg),
//  array.get(dizi3,len-1), color=color.rgb(0,255,0), width=2)
// line2=line.new((last_bar_index-ta.barssince(cr)-len),
//  array.get(dizi4,0),
//  last_bar_index-ta.barssince(cr),
//  array.get(dizi4,len-1), color=color.rgb(255, 0, 0, 0), width=2)
// line.delete(line[1])
// line.delete(line2[1])

alert=((array.get(dizi,0)<array.get(dizi,1)) and (array.get(dizi2,0)>array.get(dizi2,1)) and ta.highest(ttk[1],len/2)<1)
 or ((array.get(dizi,0)>array.get(dizi,1)) and (array.get(dizi2,0)<array.get(dizi2,1)) and ta.lowest(ttk[1],len/2)>-1)
alertcondition(alert)
hline(50)
rs=hline(30)
rss=hline(70)
fill(rs, rss, color=color.rgb(126, 87, 194, 90), title="RSI Background Fill")

longCondition = cg and ta.highest(ttk[1],len/2)<1
if (longCondition)
    strategy.entry("Long", strategy.long)
    strategy.exit("exit long", "Long", limit = close*(100+tpb)/100 , stop =close*(100-sb)/100 , trail_price = close , trail_offset = close*tsb)

shortCondition = cr and ta.lowest(ttk[1],len/2)>-1
if (shortCondition)
    strategy.entry("Short", strategy.short)
    strategy.exit("exit short", "Short", limit = close*(100-tps)/100, stop = close*(100+ss)/100, trail_price = close , trail_offset = close*tss)