
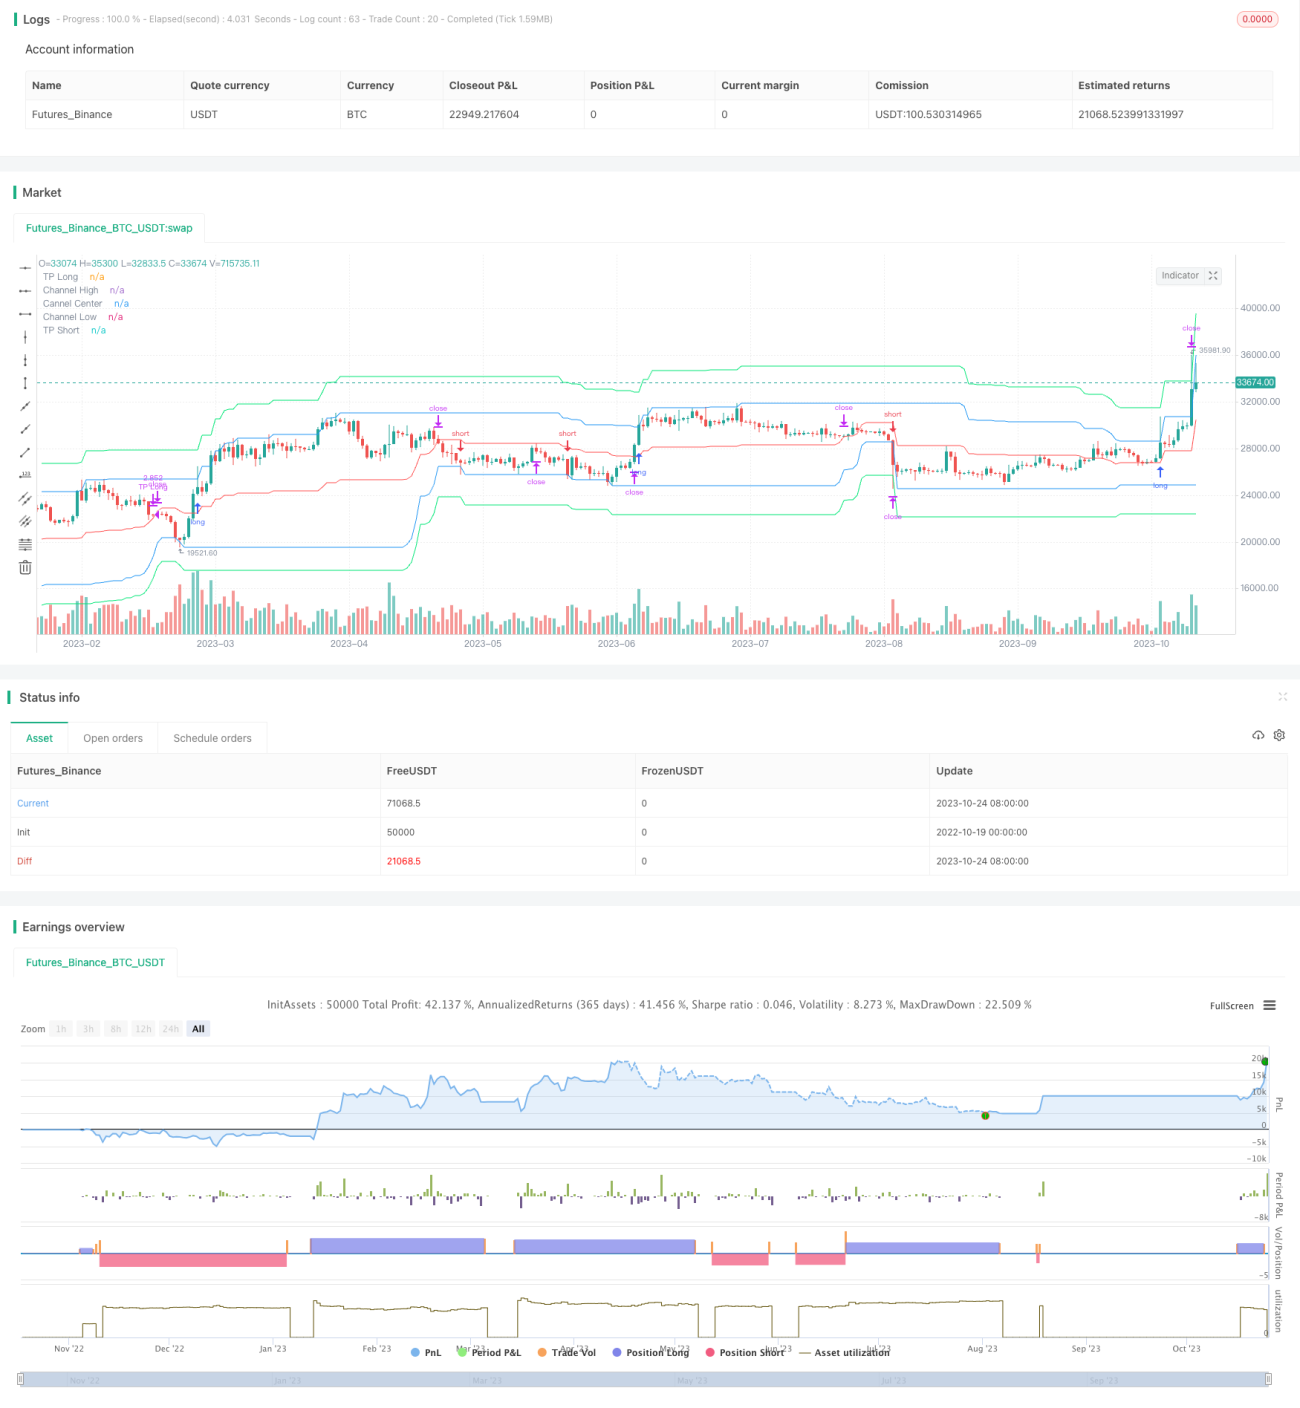
この戦略は,ドンチアン (Donchian) 通道指標に基づいて,市場動向を追跡し,トレンド取引を行う.価格がドンチアン通路を破るとき,トレンド追跡を行う.価格が通路内に戻るとき,損失平衡を施す.
特定の周期内の最高価格と最低価格を計算し,唐通路を形成する.通路の中央線は,期間中の最高価格と最低価格の平均値である.
価格が通道の上沿いを突破すると,多頭開設;価格が通道下沿いを突破すると,空頭開設.
ポジション開設後,ストップラインはチャネルの中線を追跡し,ストップラインはチャネルを突破した一定割合の価格を追跡する.
価格が通路に戻ったときに,ストップ・ロスト・プリーシングを行う.
この戦略は,トレンドの方向を判断するために,唐通路を利用し,市場突破を迅速に捉える.
経路中線追跡ストップを使用して,利潤の保護を実現できます.
ユーザの設定による止まり幅を適切に拡大する.
ポジションを柔軟に調整できる.
戦略取引の論理はシンプルでわかりやすく,理解しやすい.
この戦略は,単に通路取引を突破するだけで,整合市場への効果的対応はできない.
偽信号の破裂のリスクがあり,他の指標と組み合わせた検証が必要である.
利回り停止の設定が不適切で,早すぎる損失や不十分な利益につながる可能性があります.
通路周期の設定が不適切で,取引シグナルの正確さに影響する.
ポジションが大きすぎると,市場変動が口座に与える影響が拡大する.
ロボット取引は意外な中断のリスクがあり,システムの安定性と信頼性を確保する必要があります.
取引量指数と組み合わせて,偽の突破を追うのを避ける.
トレンド指数判断の向上,ポジション開設シグナルの正確性の向上.
ストップ・ストップ・損失アルゴリズムを最適化し,動的調整を実現する.
市場環境に応じてリアルタイムでポジション管理戦略を調整する.
試合前のデータや試合前のデータを調べて,試合のタイミングを把握する.
異なる周期パラメータをテストし,最適なパラメータ組み合わせを探します.
モデル検証モジュールを追加し,過適合を回避する.
この戦略は,全体として,よりシンプルで実用的な自己適応トレンド戦略である.迅速にトレンド突破を捕捉し,利益保護などの特徴がある.同時に,整合状態の無効性,偽突破が損失をもたらすなどのいくつかの欠点がある.将来の最適化の方向は,より多くの指標フィルタリング信号を組み合わせ,動的にストップストップの戦略を調整し,より多くの市場環境に適応することです.
/*backtest
start: 2022-10-19 00:00:00
end: 2023-10-25 00:00:00
period: 1d
basePeriod: 1h
exchanges: [{"eid":"Futures_Binance","currency":"BTC_USDT"}]
*/
//Noro
//2020
//@version=4
strategy(title = "Noro's Donchian Strategy", shorttitle = "Donchian str", overlay = true, default_qty_type = strategy.percent_of_equity, initial_capital = 100, default_qty_value = 100, commission_value = 0.1)
//Settings
needlong = input(true, defval = true, title = "Long")
needshort = input(true, defval = true, title = "Short")
tp = input(defval = 10, minval = 1, title = "Take profit")
lotsize = input(100, defval = 100, minval = 1, maxval = 10000, title = "Lot, %")
pclen = input(50, minval = 1, title = "Price Channel Length")
showll = input(true, defval = true, title = "Show lines")
showbg = input(false, defval = false, title = "Show Background")
showof = input(true, defval = true, title = "Show Offset")
fromyear = input(1900, defval = 1900, minval = 1900, maxval = 2100, title = "From Year")
toyear = input(2100, defval = 2100, minval = 1900, maxval = 2100, title = "To Year")
frommonth = input(01, defval = 01, minval = 01, maxval = 12, title = "From Month")
tomonth = input(12, defval = 12, minval = 01, maxval = 12, title = "To Month")
fromday = input(01, defval = 01, minval = 01, maxval = 31, title = "From day")
today = input(31, defval = 31, minval = 01, maxval = 31, title = "To day")
//Price Channel
h = highest(high, pclen)
l = lowest(low, pclen)
center = (h + l) / 2
tpl = h * (100 + tp) / 100
tps = l * (100 - tp) / 100
//Lines
tpcol = showll ? color.lime : na
pccol = showll ? color.blue : na
slcol = showll ? color.red : na
offset = showof ? 1 : 0
plot(tpl, offset = offset, color = tpcol, title = "TP Long")
plot(h, offset = offset, color = pccol, title = "Channel High")
plot(center, offset = offset, color = slcol, title = "Cannel Center")
plot(l, offset = offset, color = pccol, title = "Channel Low")
plot(tps, offset = offset, color = tpcol, title = "TP Short")
//Background
size = strategy.position_size
bgcol = showbg == false ? na : size > 0 ? color.lime : size < 0 ? color.red : na
bgcolor(bgcol, transp = 70)
//Trading
truetime = time > timestamp(fromyear, frommonth, fromday, 00, 00) and time < timestamp(toyear, tomonth, today, 23, 59)
lot = 0.0
lot := size != size[1] ? strategy.equity / close * lotsize / 100 : lot[1]
mo = 0
mo := strategy.position_size != 0 ? 0 : high >= center and low <= center ? 1 : mo[1]
if h > 0
strategy.entry("Long", strategy.long, lot, stop = h, when = strategy.position_size <= 0 and needlong and truetime and mo)
strategy.exit("TP Long", "Long", limit = tpl, stop = center)
strategy.entry("Short", strategy.short, lot, stop = l, when = strategy.position_size >= 0 and needshort and truetime and mo)
strategy.exit("TP Short", "Short", limit = tps, stop = center)
if time > timestamp(toyear, tomonth, today, 23, 59)
strategy.close_all()
strategy.cancel("Long")
strategy.cancel("Short")