複数の指標に基づくビットコインの毎日の取引戦略

概要
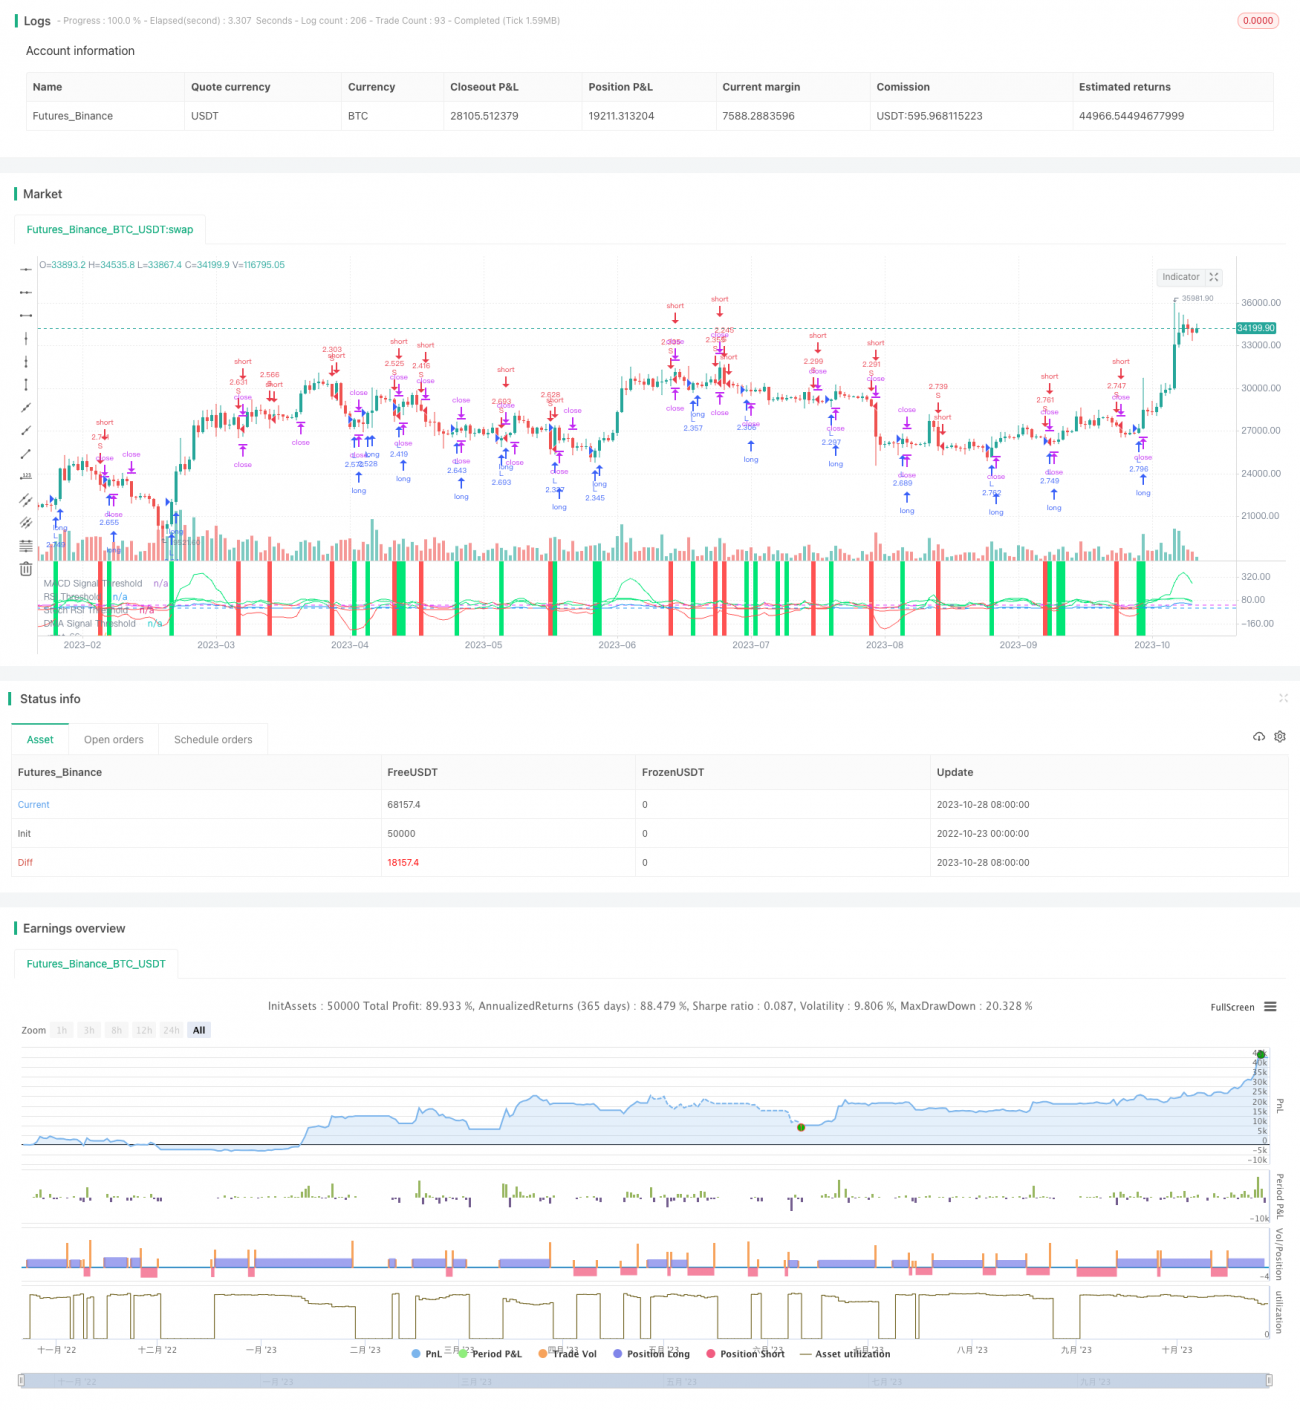
この戦略は,複数の指標の組み合わせに基づいて,ビットコインの日線時間帯で取引機会を探します. 主にMACD,RSI,Stoch RSIなどの指標を使用して,均線の方向と組み合わせて,現在のトレンドの方向を判断し,買入と売却の信号を発します.
戦略原則
この戦略は以下の指標を中心に展開しています.
-
MACD
(快线-慢线)その信号線。MACD上の信号線を穿越すると買信で,下の0穿越すると売信である。 -
RSIは相対的に強い弱さを示す指標である. RSIが設定<unk>値を越えたときに買い信号である.
-
ストッチRSI。ストッチRSI指標は,RSIの超買い超売り状況を反映している。ストッチRSIは,設定<unk>値を下回ると買入シグナル,設定<unk>値上回ると売出シグナルである。
-
平均線方向. 閉盘価格の下の平均線を突破したときに売り信号である.
この指数に基づいて,この戦略の取引シグナルは以下の通りです.
買取信号"その時は(Stoch RSI < 设定阈值) 且 (MACD上穿阈值 或 RSI上穿阈值)だった
信号を売り出した"その時は(MACD下穿0) 且 (收盘价下穿均线 或 Stoch RSI > 设定阈值)だった
複数の指標を組み合わせることで,現在のトレンドの方向を比較的に正確に判断し,トレンドの転換点で取引信号を発信することができます.
戦略的優位性
-
複数の指標を組み合わせることで,判断の正確性を高め,単一の指標によってもたらされる誤信号を回避することができる.
-
MACD指標は,現在のトレンドの方向と強さを判断できます。RSI指標は,超買い超売り状況を反映しています。Stoch RSIは,RSIの超買い超売り状況を判断しています。均線は,現在のトレンドの方向を判断しています。これらの指標は,相互に検証され,効果を高めています。
-
買入と売却のシグナルには複数の指標の組み合わせが設定されており,偽のシグナルをフィルタリングして,不必要な取引を回避できます.
-
この戦略の反省は2017年1月1日から開始し,2017年末のビットコインの大幅な上昇の状況を含んでいます.この戦略の状況でのパフォーマンスを確認できます.
-
戦略には,単一取引の損失を制御するストップ・ロス設定が含まれています.
戦略リスク
-
複数の指標の組み合わせは,正確性を向上させるが,指標の間の不一致も起こりうるため,誤判のリスクを伴う.
-
戦略を最適化するストップレスのレベルは,異なる状況に応じて調整する必要があるかもしれない。ストップレスの幅が広い場合,単一の損失が増加し,ストップレスの幅が狭い場合は,ストップレスの引き出がされる。
-
日線レベルの戦略で,より短い時間枠で細部操作ができない.突発的な事件が短期の大幅な波動を引き起こした場合,対応ができない.
-
戦略は,部分的な歴史を遡るのみで,過適合のリスクがある可能性があります.戦略の効果を検証するには,より長い時間帯とより多くの市場でテストする必要があります.
最適化の方向
-
より多くの指標の組み合わせをテストし,よりよい多指標の組み合わせ戦略を探します.
-
指数パラメータを最適化して,より適切なパラメータ数値を見つけます.
-
異なる止損レベルをテストし,止損と止止の比率の最適な組み合わせを探します.
-
長い歴史を振り返って, 超適合を避ける.
-
この戦略は,より高い頻度で,より頻繁な取引を試みます.
要約する
この戦略は,MACD,RSI,Stoch RSIなどの複数の指標を組み合わせて,現在のビットコイン日線レベルのトレンド方向を判断し,トレンド転換点で取引シグナルを発信する. この戦略は,取引リスクを制御するためにストップを設定する. この戦略は,優れた結果を出している. しかし,適合リスクを避けるために,より長い時間とより多くの市場で検証する必要があります.
/*backtest
start: 2022-10-23 00:00:00
end: 2023-10-29 00:00:00
period: 1d
basePeriod: 1h
exchanges: [{"eid":"Futures_Binance","currency":"BTC_USDT"}]
*/

//@version=4
// Original code is from CredibleHulk and modified by bennef
strategy("BTC Daily Strategy BF", overlay=false, initial_capital=10000, default_qty_type=strategy.percent_of_equity, default_qty_value=100, commission_type=strategy.commission.percent, commission_value=0.075)
- 1