
双方向圧力を加えた取引戦略は,ランダムな指標と交替量指標を組み合わせたトレンド追跡戦略である.この戦略は,主にランダムな指標KとDラインと交替量指標を使用して,購入と販売の信号を生成し,均線金叉と死叉によって追加の信号を生成する.
買取シグナルの主なトリガーロジックは,
K線とD線が同時に超売り区域 (例えば20) を破り,上方交差を生じ,K線とD線が同時に上昇傾向にある
取引量は一定値 (例えば1.4倍平均取引量) を上回る
閉店価格は開店価格より高い (白いK線)
追加的な買取シグナルは以下のものからもたらされる:
均線金叉:高速EMA線で遅いEMA線を穿え,両均線が同時に上昇する
K線とD線は同時に低値から超売り領域に入ります (例えば,20の下から20から80の区間への上昇)
売れ行きのシグナルの主なトリガーロジックは,
K線とD線は同時に超売り領域に入ります (例えば80).
均線死叉:高速EMA線の下を通過する遅いEMA線
K線がD線を横切って,K線とD線の両方が下向きです.
購入価格の一定パーセント (例えば6%) をストップラインとして設定し,価格がこのラインを下回るとストップ・セールをトリガーする.
単一のランダムな指標は,大量の偽信号を生成する可能性がある.この戦略は,K線とD線 (K線の移動平均線) の二重ランダムな指標の組み合わせを採用し,偽信号を効果的にフィルターし,信号の信頼性を確保することができる.
取引量条件を補助判断基準として追加し,取引量が一定レベルを超えることを要求し,低量の非トレンドの買入点をフィルタリングし,被套のリスクを軽減します.
戦略は,ランダムな指標,取引量指標,平均線指標の複数の買入シグナルをまとめており,これらのシグナルは,真の取引シグナルを生成するために同時にトリガーする必要があります.複数の指標の重叠は,シグナルの信頼性を向上させることができます.
平均線判断のルールを加え,例えば,平均線が同時に上昇する時のみで買い信号を考慮する。これは逆勢買いやピークを避けるため,大時間周期からトレンドを判断する。
戦略は,ストップ・ロスの信号設計を含み,価格が買入時に一定の割合を下回れば自動的にストップする.これは,1回の取引の最大損失を効果的に制御する.
この戦略には,ランダム指数パラメータ,平均線パラメータ,交配量パラメータなどの複数のパラメータが含まれている.これらのパラメータは,異なる品種に対して最適化する必要があり,不適切な設定は,結果に劣等感をもたらす可能性がある.
ストップポイントを設定する際には,価格が飛躍する可能性を考慮する必要がある.ストップポイントが購入価格にあまりにも近い場合,飛躍によって不必要なストップが発生する可能性があります.
流動性が低い品種の場合,交交差量規則は過剰な信号をフィルタリングする可能性があります.このとき,交差量条件の制限を下げる必要があります.
異なる周期指標の間に位序不一致が生じる可能性があり,これは信号の正確さに影響する.信号点位序一致を検証する必要がある.
この戦略は以下の点で最適化できます.
安定性を高めるための最適化パラメータ
機械学習方法の動的調整パラメータを追加する
ストップ・ローズを減らすための最適化戦略
フィルタリング条件を追加し,取引数を減らす
条件付き単一または停止戦略で利回りを上げることを試みる
遺伝的アルゴリズムなどのより体系的な方法によって主要なパラメータを最適化することができ,パラメータが異なる市場サイクルで安定したパフォーマンスを得ることを保証します.
市場状況をリアルタイムで評価するモデルを訓練し,それに応じて戦略パラメータを調整し,パラメータのダイナミックな最適化を可能にします.
より良いストップ・ストラトジーを研究し,リスクをコントロールしながら,不必要なストップ・ストラストを最小限に抑え,利益の余地を増やすことができます.
フィルタリング条件を適切に強化することで,取引の数を減らすこと,取引コストの影響を軽減し,取引毎のリターンを増やすことができます.
市場特性に応じて,設計条件単一戦略または移動ストップストップ戦略で,ストップ損失を保証しながら,利潤を最大限にするように平準ポジションを設定できます.
この戦略は,トレンド判断,リスク管理,取引頻度などの複数の側面を総合的に考慮している. 核心的な優位性は,二重ランダム指標が交量指標判断トレンドとリスク管理のストップダストを組み合わせることです. 次のステップでは,パラメータの安定性を向上させ,パラメータを動的に調整し,ストップダスト率を低下させ,戦略がより多くの市場環境で安定した収益を得ることができるように最適化することができます.
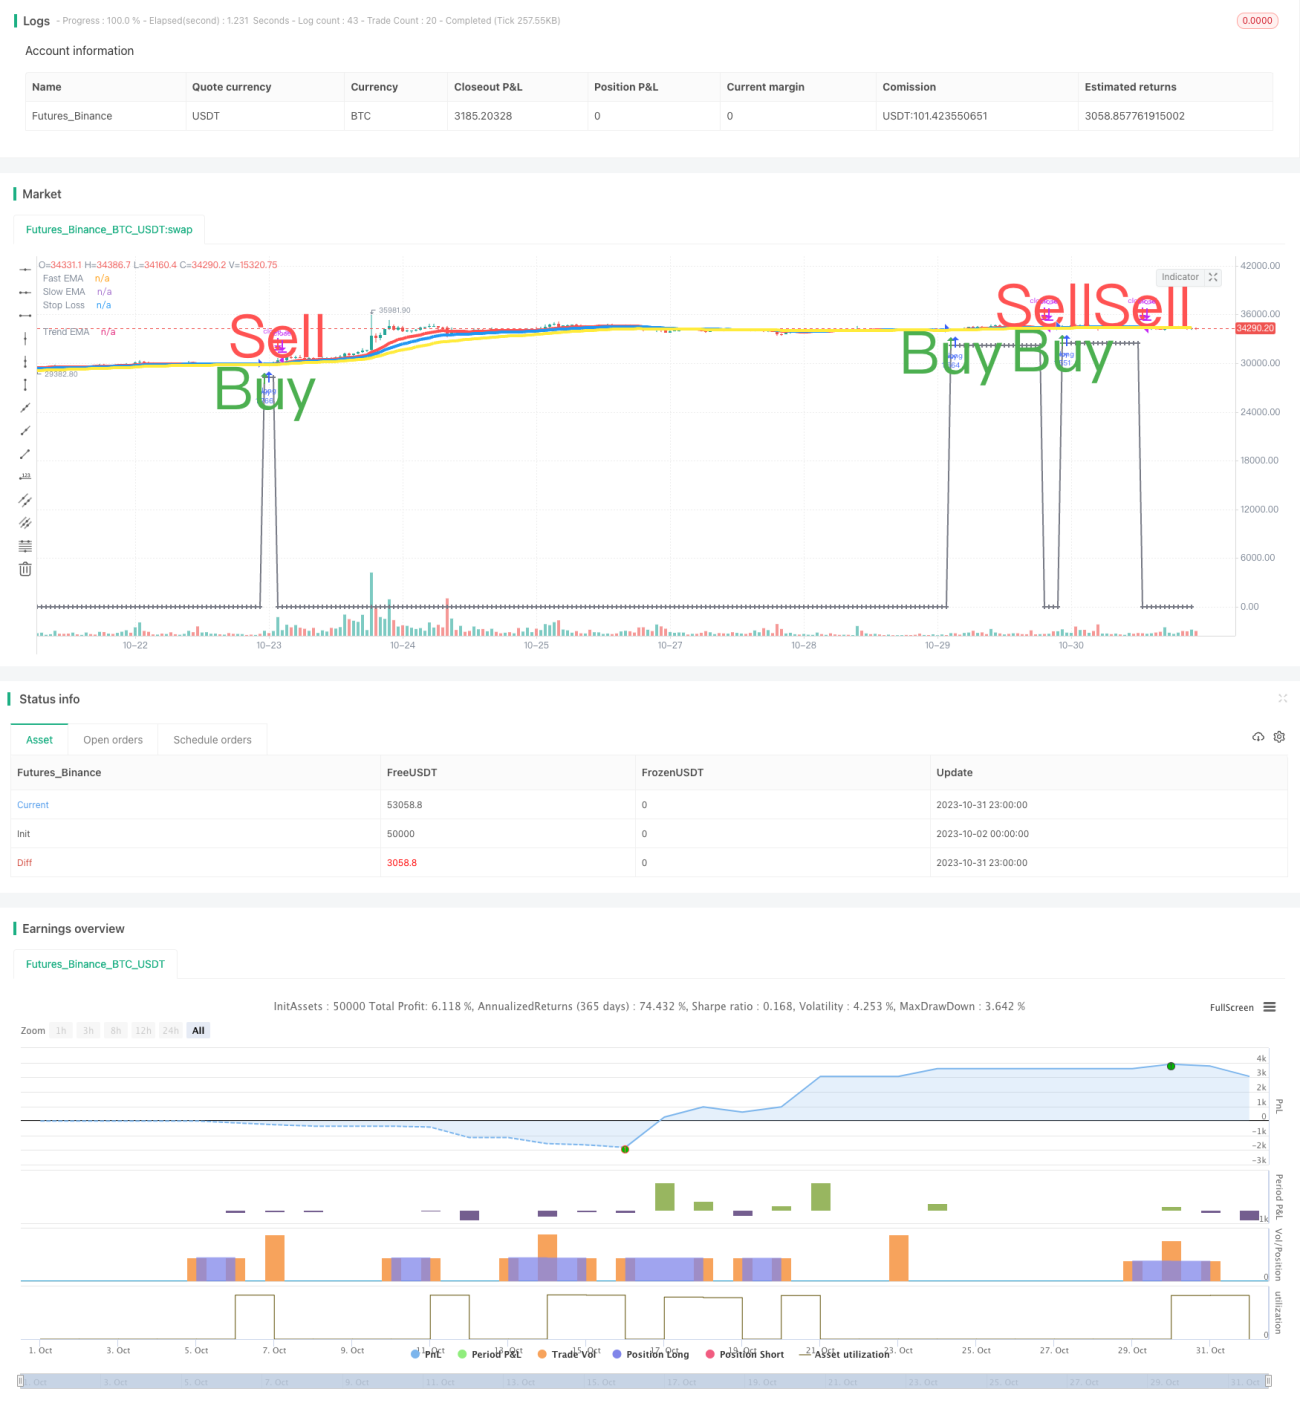
/*backtest
start: 2023-10-02 00:00:00
end: 2023-11-01 00:00:00
period: 1h
basePeriod: 15m
exchanges: [{"eid":"Futures_Binance","currency":"BTC_USDT"}]
*/
//@version=3
// SW SVE - Stochastic+Vol+EMAs [Sergio Waldoke]
// Script created by Sergio Waldoke (BETA VERSION v0.5, fine tuning PENDING)
// Stochastic process is the main source of signals, reinforced on buying by Volume. Also by Golden Cross.
// Selling is determined by K and D entering overselling zone or EMA's Death Cross signal, the first occurring,
// and some other signals combined.
// Buy Long when you see a long buy arrow.
// Sell when you see a close arrow.
// This is a version to be tuned and improved, but already showing excelent results after tune some parameters
// according to the kind of market.
// Strategy ready for doing backtests.
// SVE SYSTEM DESIGN:
// Buy Signal Trigger:
// - Both Stoch <= 20 crossing up and both growing and green candle and Vol/sma vol >= 1.40 Avg Vol
// or
// - Both Stoch growing up and Vol/sma vol >= 1.40 Avg Vol and green candle and
// both prior Stoch crossing up
// or
// [OPTIONAL]: (Bad for BTC 2018, excelent for 2017)
// - Crossingover(fast_ema, slow_ema) and growing(fast_ema) and growing(slow_ema) and green candle
// Exit position:
// - Both Stoch <= 20 and Both Stoch were > 20 during position
// or
// - CrossingUnder(Fast EMA, Medium EMA)
// or [OPTIONAL] (Better for BTC 2018, Worse for BNB 1H)
// - CrossingUnder(k, d) and (k and d starting over over_buying) and (k and d descending) and k crossing down over_buying line
//calc_on_every_tick=true,
//calc_on_order_fills=true, (affects historical calculation, triggers in middle of the bar, may be better for automatic orders)
strategy("SW SVE - Stochastic+Vol+EMAs [Sergio Waldoke]", shorttitle="SW SVE", overlay=true, max_bars_back=5000,
default_qty_type=strategy.percent_of_equity, default_qty_value=100, currency="USD",
commission_type=strategy.commission.percent, commission_value=0.25)
//Strategy Parameters
FromDay = input(defval = 1, title = "From Day", minval = 1, maxval = 31)
FromMonth = input(defval = 1, title = "From Month", minval = 1, maxval = 12)
FromYear = input(defval = 2018, title = "From Year", minval = 2009, maxval = 2200)
ToDay = input(defval = 31, title = "To Day", minval = 1, maxval = 31)
ToMonth = input(defval = 12, title = "To Month", minval = 1, maxval = 12)
ToYear = input(defval = 2030, title = "To Year", minval = 2009, maxval = 2200)
//Indicator Parameters
//Original defaults for 4HS: 14, 3, 80, 20, 14, 23, 40, 20, 40, 3:
stoch_k = input(title="Stoch K", defval=14, minval=1)
stoch_d = input(title="Stoch D", defval=3, minval=1)
over_buying = input(title="Stoch Overbuying Zone", defval=80, minval=0, maxval=100)
over_selling = input(title="Stoch Overselling Zone", defval=20, minval=0, maxval=100)
fast_ema_periods = input(title="Fast EMA (Death Cross)", defval=14, minval=1, maxval=600)
slow_ema_periods = input(title="Slow EMA (Death Cross)", defval=23, minval=1, maxval=600)
trend_ema_periods = input(title="Slowest EMA (Trend Test)", defval=40, minval=1, maxval=600)
volume_periods = input(title="Volume Periods", defval=20, minval=1, maxval=600)
volume_factor = input(title="Min Volume/Media Increase (%)", defval=80, minval=-100) / 100 + 1
threshold_sl_perc = input(title="[Sell Trigger] Stop Loss Threshold %", defval=6.0, type=float, minval=0, maxval=100)
//before_buy = input(title="# Growing Before Buy", defval=2, minval=1)
//before_sell = input(title="# Decreasing Before Sell", defval=1, minval=1)
//stepsignal = input(title="Show White Steps", type=bool, defval=true)
//steps_base = input(title="White Steps Base", defval=242, minval=0)
//Signals
fast_ema = ema(close, fast_ema_periods)
slow_ema = ema(close, slow_ema_periods)
trend_ema = ema(close, trend_ema_periods)
k = stoch(close, high, low, stoch_k)
d = sma(k, stoch_d)
vol_ma = sma(volume, volume_periods)
//REVIEW CONSTANT 1.75:
in_middle_zone(a) => a > over_selling * 1.75 and a < over_buying
growing(a) => a > a[1]
was_in_middle_zone = k == d
was_in_middle_zone := was_in_middle_zone[1] or in_middle_zone(k) and in_middle_zone(d)
//Buy Signal Trigger:
//- Both Stoch <= 20 crossing up and both growing and
// green candle and Vol/sma vol >= 1.40 Avg Vol
buy = k <= over_selling and d <= over_selling and crossover(k, d) and growing(k) and growing(d) and
close > open and volume/vol_ma >= volume_factor
//or
//- Both Stoch growing up and Vol/sma vol >= 1.40 Avg Vol and green candle and
// both prior Stoch crossing up
buy := buy or (growing(k) and growing(d) and volume/vol_ma >= volume_factor and close > open and
crossover(k[1], d[1]) )
//Worse:
// (crossover(k[1], d[1]) or (crossover(k, d) and k[1] <= over_selling and d[1] <= over_selling) ) )
//or
// [OPTIONAL]: (Bad for BTC 2018, excelent for 2017)
//- Crossingover(fast_ema, slow_ema) and growing(fast_ema) and growing(slow_ema) and green candle
buy := buy or (crossover(fast_ema, slow_ema) and growing(fast_ema) and growing(slow_ema) and close > open)
//Debug:
//d1 = close > open ? 400 : 0
//plot(d1+5200, color=white, linewidth = 3, style = stepline)
//Exit position:
//- Both Stoch <= 20 and Both Stoch were > 20 during position
sell = k <= over_selling and d <= over_selling and was_in_middle_zone
// or
//- CrossingUnder(Fast EMA, Medium EMA)
sell := sell or crossunder(fast_ema, slow_ema)
// or [OPTIONAL] (Better for BTC 2018, Worse for BNB 1H)
//- CrossingUnder(k, d) and (k and d starting over over_buying) and (k and d descending) and k crossing down over_buying line
sell := sell or (crossunder(k, d) and k[1] >= over_buying and d[1] >= over_buying and
not growing(k) and not growing(d) and k <= over_buying)
color = buy ? green : red
bought_price = close
bought_price := nz(bought_price[1])
already_bought = false
already_bought := nz(already_bought[1], false)
//Date Ranges
buy := buy and not already_bought
//d1 = buy ? 400 : 0
//plot(d1+6500, color=white, linewidth = 3, style = stepline)
was_in_middle_zone := (not buy and was_in_middle_zone) or (in_middle_zone(k) and in_middle_zone(d))
already_bought := already_bought[1] or buy
bought_price := buy ? close * (1 - threshold_sl_perc/100) : bought_price[1]
trigger_SL = close < bought_price[0]
sell := sell or trigger_SL
sell := sell and
already_bought and not buy and (was_in_middle_zone or trigger_SL)
//plot((sell?400:0)+5200, title="Buy-Sell", color=yellow, linewidth = 3, style = stepline)
already_bought := already_bought[0] and not sell
bought_price := sell ? 0 : bought_price[0]
//plot((was_in_middle_zone?400:0)+5200, title="Buy-Sell", color=yellow, linewidth = 3, style = stepline)
was_in_middle_zone := not sell and was_in_middle_zone
//Plot signals
plot(fast_ema, title="Fast EMA", color=red, linewidth = 4)
plot(slow_ema, title="Slow EMA", color=blue, linewidth = 4)
plot(trend_ema, title="Trend EMA", color=yellow, linewidth = 4)
//Stop Loss
plot(bought_price, color=gray, linewidth=2, style=cross, join=true, title="Stop Loss")
//Y = stepsignal ? lowest(40) : na
//Y = steps_base
//plot(mysignal+Y, title="Steps", color=white, linewidth = 3, style = stepline)
//Unit steps - for debugging
//plot(mysteps+Y, title="Steps2", color=yellow, linewidth = 3, style = stepline)
//Bought or not - for debugging
//plot((already_bought?400:0)+5200, title="Buy-Sell", color=yellow, linewidth = 3, style = stepline)
//plot((sell?400:0)+5200, title="Buy-Sell", color=yellow, linewidth = 3, style = stepline)
plotshape(buy, title="Buy arrows", style=shape.arrowup, location=location.belowbar, color=color, text="Buy", textcolor=color, size=size.huge, transp=30)
plotshape(sell, title="Sell arrows", style=shape.arrowdown, location=location.abovebar, color=color, text="Sell", textcolor=color, size=size.huge, transp=30)
//if n>2000
strategy.entry("buy", strategy.long, when=buy)
strategy.close_all(when=sell)
//plot(strategy.equity, title="Equity", color=white, linewidth = 4, style = line)
//AlertS trigger
//msg = "[SW Magic Signals EMA] BUY/SELL Signal has been triggered." + "(" + tostring(fastema) + ", " + tostring(slowema) + ") on " + tickerid + ", " + period + "."
msg = "SW SVE BUY/SELL Signal has been triggered. (#, #) on EXCH:PAIR, period: #."
alertcondition(buy or sell, title="SW SVE (BUY/SELL SIGNAL)", message=msg)
alertcondition(buy, title="SW SVE (BUY SIGNAL)", message=msg)
alertcondition(sell, title="SW SVE (SELL SIGNAL)", message=msg)