トレンドフォローストップに基づくモメンタム取引戦略


作成日: 2023-11-02 13:59:20 最終変更日: 2023-11-02 13:59:20
コピー: 0 クリック数: 694
1
フォロー
1617
フォロワー

トレンドフォローストップに基づくモメンタム取引戦略

概要

この戦略は,運動指数RSIとトレンドフォローストップ指数SuperTrendをベースに,中長線の動的取引戦略を設計した.この戦略は,主に株価に存在するトレンド的運動を識別するために使用され,利益をロックするためにストップと連携して,大幅な撤回の可能性を減らすために使用されます.

原則

  1. RSIを使って株の動向を把握する

RSI指標は,株価のトレンドを効果的に識別できます.RSIが60を超えると,買い増し領域であり,現在の株は強烈な上昇傾向にあることを示します.RSIが40を下ると,売り増し領域であり,現在の株は下落傾向にあることを示します.

この戦略は,RSIが60より大きいときに買取シグナルを生じ,株価の上昇を認識し,買取を行うことを意味する.

  1. 超トレンドでトレンドを追跡するストップ

スーパートレンドは,ATRと価格自体に基づいて動的なストップラインを計算するトレンド追跡指標である.価格がこのストップラインを突破すると,トレンドが逆転し,現在のポジションをストップする.

この戦略は,スーパートレンド指数で計算されたストップラインをストップポイントとして使用し,価格がストップラインを突破すると即座に平仓を停止します.

利点

  1. トレンドの動力を識別する

RSI指標を使用すると,株価に存在する傾向的な動力を効果的に識別することができ,価格が傾向形成の早期に参入し,潜在的な利益の余地がより大きい.

  1. リスクのコントロールと利益のロック

スーパートレンド指数のストップラインを用いれば,タイミングよくストップを出し,過剰な撤回を避けることができる.また,トレンドの推移とともにストップラインを徐々に上げ,利益をロックすることもできる.

  1. 戦略の論理は明確でシンプルです.

この策略は,それぞれ明確な意味を持つ2つの指標の組み合わせを使用し,戦略の論理はシンプルで明確で,容易に理解し,検証されます.

リスク

  1. 偽の突破による停止が引き起こされた

集積期間に,価格にいくつかの短期的な突破があり,迅速な修正の偽突破が発生する可能性があります. これは,ストップラインが誘発され,いくつかの不必要な損失を生じさせる可能性があります.

  1. 関連性のある大盤に追随する

この戦略は,株式のトレンド動力を認識しているので,そのパフォーマンスは,大市市場の動きを一定程度に追随する.大市市場の調整が発生した場合,戦略は,追加の損失を生じることがあります.

  1. 逆転が認められない

この戦略は,トレンドを識別し,追跡することに専念し,トレンドの逆転を効果的に識別することはできません.突然のトレンドの逆転が起こった場合,戦略は困難であり,時間の無駄になり,大きな損失を引き起こす可能性があります.

最適化の方向

  1. RSIパラメータを最適化し,識別精度を向上させる

異なるRSIパラメータをテストして,最適のパラメータの組み合わせを見つけ,RSIがトレンドを認識する精度を向上させることができます.

  1. ストップ・ロスの戦略を最適化し,ストップ・ロスの率を下げる

異なるタイプのストップを試すことができる.例えば,出場前に一定の周期を待つなど,高頻度の偽突破ストップの出場を避ける.

  1. トレンド反転の信号を増やす

MACDなどの指標を導入することで,トレンドの逆転を早期に認識し,強気なトレンドの逆転に伴う大きな損失を回避することが考えられます.

  1. 適切なヘッジメントを考える

大規模な市場調整に直面する際には,策略の市場関連性を低下させるため,ある種のヘッジポートフォリオを追加することを検討することができます.

要約する

この戦略は,RSIのトレンド動力を識別し,SuperTrendのトレンドを追跡し,ストップオフの2つの重要な要素を構成し,簡単な実用的な中長線動力の戦略を構築しています. この戦略は,トレンドを効果的に追跡し,ストップオフのリスクを制御します. パラメータの最適化や反転信号の追加などの手段によって,戦略のパフォーマンスをさらに強化することができます. 全体的に,この戦略は,強力な実用性を持っています.

ストラテジーソースコード
/*backtest
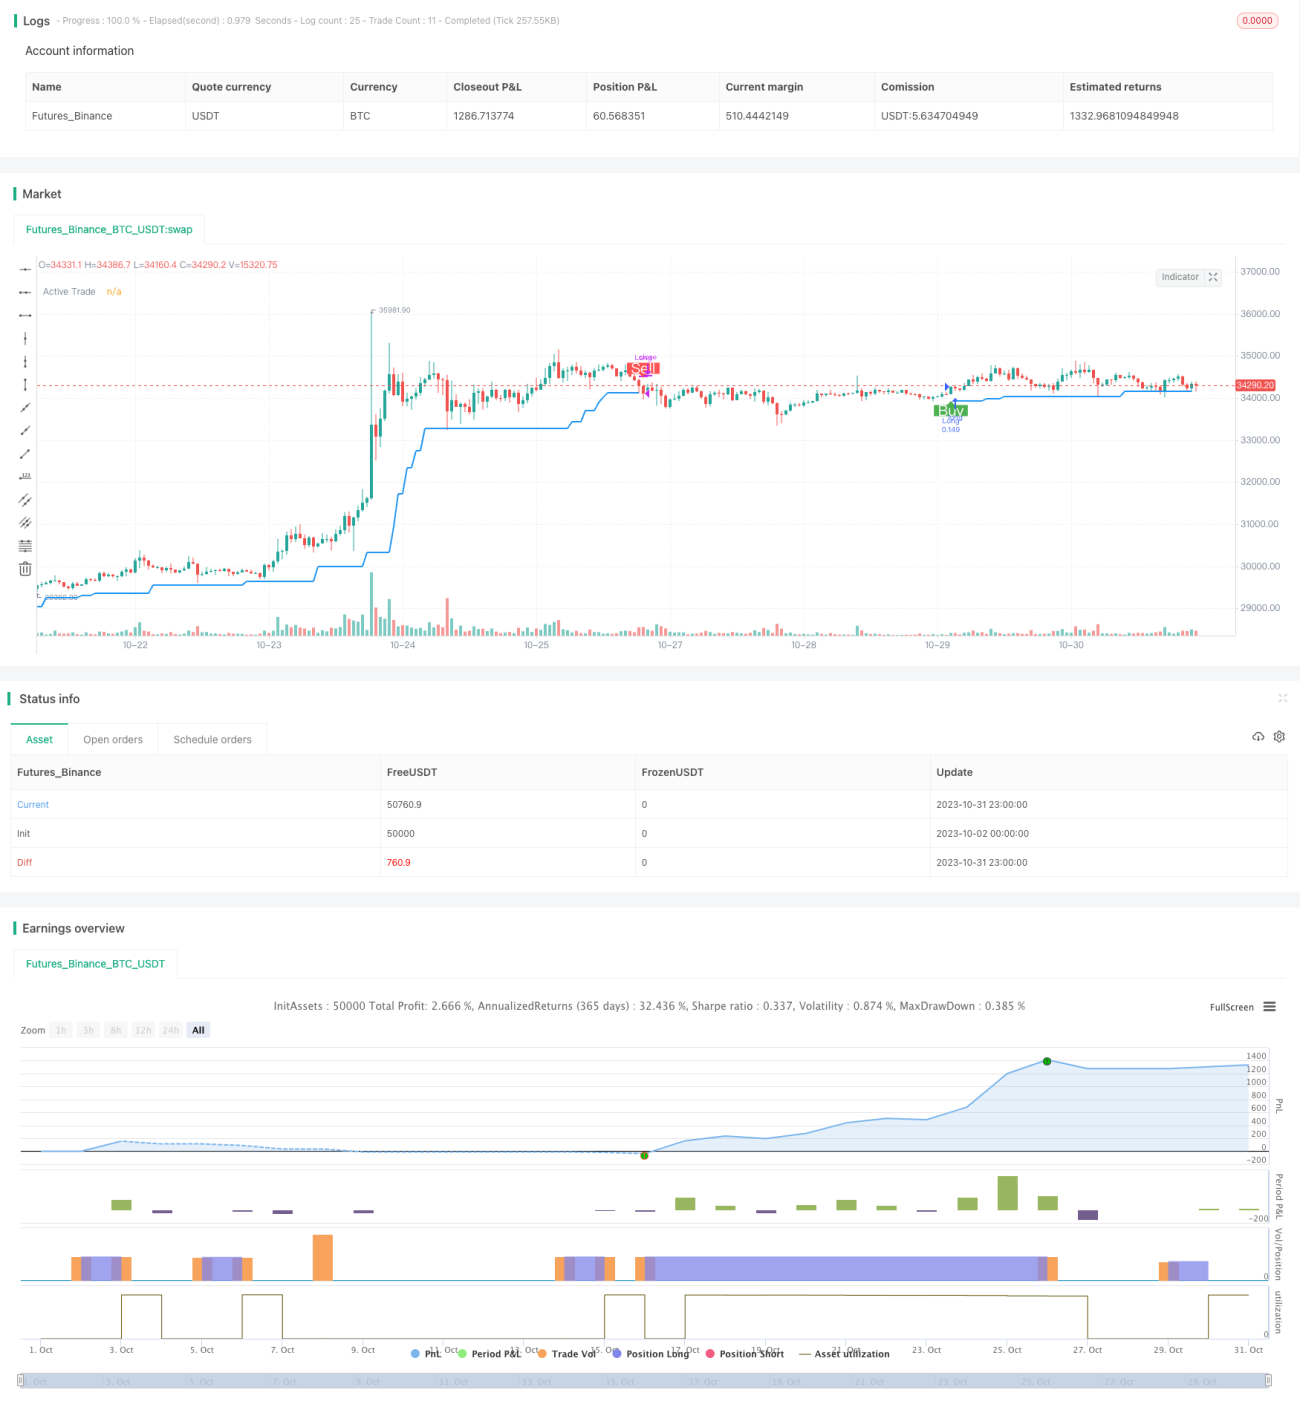
start: 2023-10-02 00:00:00
end: 2023-11-01 00:00:00
period: 1h
basePeriod: 15m
exchanges: [{"eid":"Futures_Binance","currency":"BTC_USDT"}]
*/

//@version=4
//
// ▒▒▒▒▒▒▒▒▒▒▒▒▒▒▒▒▒▒▒▒▒▒▒▒▒▒▒▒▒▒▒▒▒▒▒▒▒▒▒▒▒▒▒▒▒▒▒▒▒▒▒▒▒▒▒▒▒▒▒▒▒▒▒▒▒▒▒▒▒▒▒▒▒▒▒▒▒▒▒▒▒▒▒▒▒▒▒▒▒▒▒▒▒▒▒▒▒▒▒▒▒▒▒▒▒▒▒▒▒▒▒▒▒▒ 
//  -----------------------------------------------------------------------------
//  Copyright 2021 Amey Tavkar
//  Momentum Trading Strategy (Weekly Chart) script may be freely distributed under the MIT license.
//
//  Permission is hereby granted, free of charge, 
//  to any person obtaining a copy of this software and associated documentation files (the "Software"), 
//  to deal in the Software without restriction, including without limitation the rights to use, copy, modify, merge, 
//  publish, distribute, sublicense, and/or sell copies of the Software, and to permit persons to whom the Software is furnished to do so, 
//  subject to the following conditions:
//
//  The above copyright notice and this permission notice shall be included in all copies or substantial portions of the Software.
//
//  THE SOFTWARE IS PROVIDED "AS IS", WITHOUT WARRANTY OF ANY KIND, 
//  EXPRESS OR IMPLIED, INCLUDING BUT NOT LIMITED TO THE WARRANTIES OF MERCHANTABILITY, 
//  FITNESS FOR A PARTICULAR PURPOSE AND NONINFRINGEMENT. IN NO EVENT SHALL THE AUTHORS OR COPYRIGHT HOLDERS BE LIABLE FOR ANY CLAIM, 
//  DAMAGES OR OTHER LIABILITY, WHETHER IN AN ACTION OF CONTRACT, TORT OR OTHERWISE, ARISING FROM, 
//  OUT OF OR IN CONNECTION WITH THE SOFTWARE OR THE USE OR OTHER DEALINGS IN THE SOFTWARE.
//
//  -----------------------------------------------------------------------------
//
//  Description
//  ===========
//  The strategy will open position when there is momentum in the stock
//  The strategy will ride up your stop loss based on the super trend.
//  The strategy will close your operation when the market price crossed the stop loss.
//  The strategy will close operation when the line based on the volatility will crossed
//
//  
//  -----------------------------------------------------------------------------
//  Disclaimer:
//    1. I am not licensed financial advisors or broker dealers. I do not tell you 
//       when or what to buy or sell. I developed this software which enables you 
//       execute manual or automated trades multplierFactoriplierFactoriple trades using TradingView. The 
//       software allows you to set the criteria you want for entering and exiting 
//       trades.
//    2. Do not trade with money you cannot afford to lose.
//    3. I do not guarantee consistent profits or that anyone can make money with no 
//       effort. And I am not selling the holy grail.
//    4. Every system can have winning and losing streaks.
//    5. Money management plays a large role in the results of your trading. For 
//       example: lot size, account size, broker leverage, and broker margin call 
//       rules all have an effect on results. Also, your Take Profit and Stop Loss 
//       settings for individual pair trades and for overall account equity have a 
//       major impact on results. If you are new to trading and do not understand 
//       these items, then I recommend you seek education materials to further your
//       knowledge.
//
//    YOU NEED TO FIND AND USE THE TRADING SYSTEM THAT WORKS BEST FOR YOU AND YOUR 
//    TRADING TOLERANCE.
//
//    I HAVE PROVIDED NOTHING MORE THAN A TOOL WITH OPTIONS FOR YOU TO TRADE WITH THIS PROGRAM ON TRADINGVIEW.
//    
//    I accept suggestions to improve the script.
//    If you encounter any problems I will be happy to share with me.
//  -----------------------------------------------------------------------------
//
// ▒▒▒▒▒▒▒▒▒▒▒▒▒▒▒▒▒▒▒▒▒▒▒▒▒▒▒▒▒▒▒▒▒▒▒▒▒▒▒▒▒▒▒▒▒▒▒▒▒▒▒▒▒▒▒▒▒▒▒▒▒▒▒▒▒▒▒▒▒▒▒▒▒▒▒▒▒▒▒▒▒▒▒▒▒▒▒▒▒▒▒▒▒▒▒▒▒▒▒
strategy("Momentum Trading Strategy (Weekly Chart)", precision = 2, overlay = true, default_qty_type = strategy.percent_of_equity, default_qty_value = 10)

//Entry
[fastSupertrend, fastSupertrendDir]  = supertrend(5, 1)
rsi = rsi(close, 14)
entry = close > fastSupertrend and rsi > 60
strategy.entry("Long", strategy.long, when = entry)
plotshape(entry and strategy.opentrades == 0,color=color.green,text="Buy",location=location.belowbar,style=shape.labelup,textcolor=color.white, size = size.normal)
plot(fastSupertrendDir == -1 and strategy.opentrades == 1  ? fastSupertrend : na, title="Active Trade", style=plot.style_linebr, linewidth=2, color=color.blue)

//Exit
exit = close < fastSupertrend
strategy.close("Long", when = exit)
plotshape(exit and strategy.opentrades == 1,color=color.red,text="Sell",style=shape.labeldown,textcolor=color.white, size=size.normal)