トレンドに基づくカロビン平均回帰戦略


作成日: 2023-11-03 16:56:13 最終変更日: 2023-11-03 16:56:13
コピー: 1 クリック数: 752
1
フォロー
1617
フォロワー

トレンドに基づくカロビン平均回帰戦略

概要

この戦略は,Karobein平均回帰指数と価格の動きに基づいています.これは,価格の動き補助指数を使用して,トレンド判断を行い,Karobein平均回帰指数と組み合わせて具体的な入場を行います.この戦略は,中長期線取引に適用されます.

戦略原則

この戦略は,まず,異なる周期の価格の変化率を計算することによって,価格動力の指数を得ます.価格動力の指数は,動的な値線を横切るときに多頭シグナルを生成し,下を通るときに空頭シグナルを生成します.

その後,Karobein平均回帰指数と組み合わせて特定の入場時間を決定する.Karobein平均回帰指数は,価格の均線回帰特性をベースに計算され,価格の変動加速度と経路を反映する.この指数は,価格の動きの方向と時間節を判断するのに役立つ内在の正弦波特性を有する.

価格動態指標が信号を発したときに,Karobein平均回帰指標が対応する方向領域にある場合,入場信号が生成されます.

戦略的優位性

  1. この戦略の総合は,価格動力と平均値回帰の2つの要因を考慮し,強い傾向判断能力を有する.

  2. Karobein平均回帰指数は,入場時刻の精度を向上させるため,価格転換点を正確に決定します.

  3. パラメータで自由に制御できる持仓周期は,異なる時間周期に適用されます.

  4. ダイナミックな値下げパラメータをリアルタイムで調整し,市場の変化に自律的に適応します.

戦略リスク

  1. この策略はトレンドフォロー策略であり,揺れ動いているトレンドでは簡単に騙される.

  2. カーロベイン平均値回帰指数は,価格転換点を逃す可能性があるため,一定の遅れがあります.

  3. 持仓周期パラメータの設定に注意してください. 持仓期間が長すぎると損失が拡大する可能性があります.

  4. ダイナミック値下がりパラメータを適切に調整し,過剰に設定してはいけない.そうしないと,入場時間を逃すだろう.

リスクに対する対処法:

  1. トレンド判断の指標によって,震動が来るのを予期し,適時に平仓を止めてしまう.

  2. 適切な周期のKarobein平均値帰帰指数を選択し,あまりにも遅滞してはならない.

  3. 異なる保有時間パラメータをテストし,自分の適した保有時間を選択してください.

  4. 動的値の範囲を調整し,入場点を漏らさないようにしすぎない.

戦略最適化の方向性

  1. 異なる価格動力の計算周期をテストし,パラメータを最適化できます.

  2. 波動率指数で震動が近づいていることを判断し,ストップダストを設定できます.

  3. カロベイン平均回帰指数パラメータを最適化して,より敏感にします.

  4. 取引量指数などの追加のフィルタリング条件が加えられ,信号の質を向上させる.

  5. 機械学習アルゴリズムの動的最適化パラメータを使用できます.

要約する

この戦略は,価格動力要因と平均値回帰要因を総合的に考慮し,強い傾向判断とシグナル生成能力を有する.異なる市場環境にパラメータを介して自律的に適応することができる.次のステップは,入場時間,停止の観点からさらに最適化され,戦略をより安定的かつ強力にすることができる.この戦略は,さらなる研究と適用に値する.
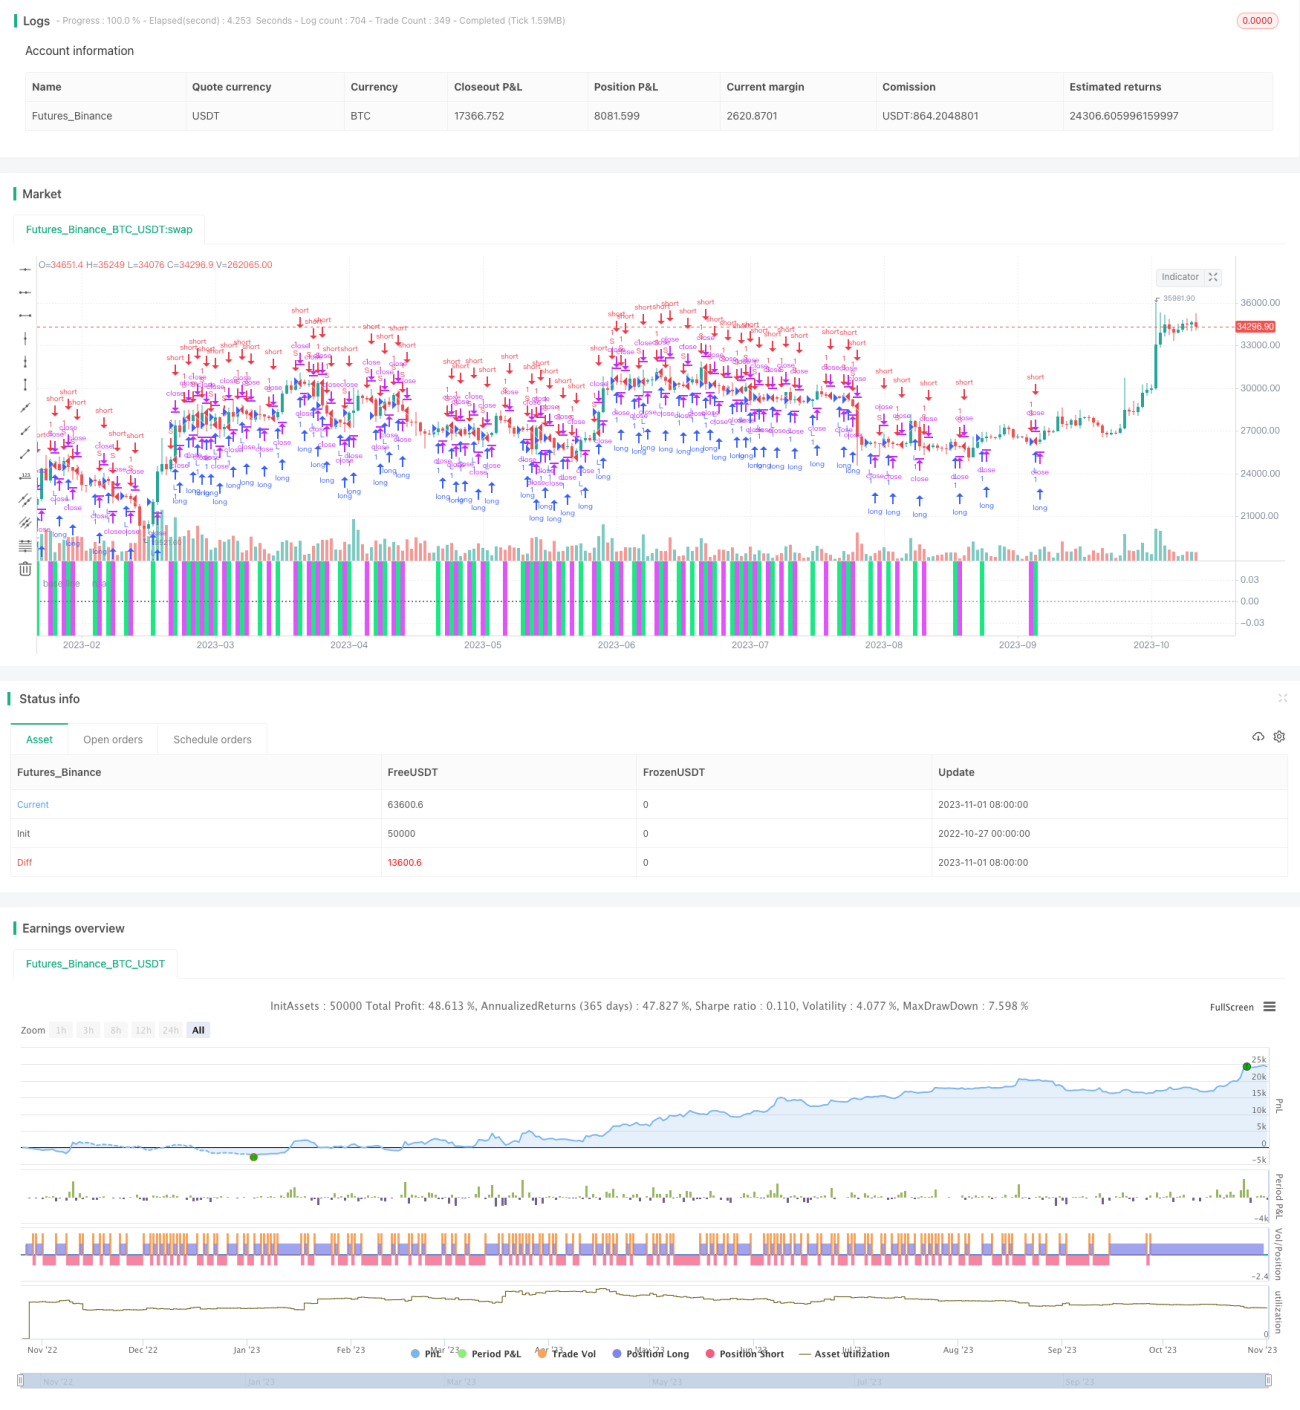
ストラテジーソースコード
/*backtest
start: 2022-10-27 00:00:00
end: 2023-11-02 00:00:00
period: 1d
basePeriod: 1h
exchanges: [{"eid":"Futures_Binance","currency":"BTC_USDT"}]
*/

//@version=4
// author: capissimo
strategy("Normalized Vector Strategy, ver.3 (sc)", precision=2, overlay=false)
// This is a scaled Normalized Vector Strategy with a Karobein Oscillator
// original: Drkhodakarami (https://www.tradingview.com/script/Fxv2xFWe-Normalized-Vector-Strategy-By-Drkhodakarami-Opensource/)

// Repainting: in general there two types of repainting:
// * when the last candle is constantly being redrawn
// * when the indicator draws a different configuration after it has been deactivated/reactivated, i.e. refreshed

// The former is a natural behaviour, which presents a constant source of frustration, 
// when a signal directly depends on the current market situation and can be overcome 
// with various indirect techniques like divergence.

// The latter suggests a flaw in the indicator design.
// Unfortunately, the Normalized Vector Strategy is repainting in the latter sense, although being
// really promising. Would be nice if our community suggests a solution to this problem ))

// This strat consistently performs with high accuracy, showing up to 96% scores
// Here are some of the best parameters:
// TF     Lookback   Performance (ca.)
// 1m     13         92%
// 3m     34         92%
// 5m     85         92%
// 15m    210        90%
// 30m    360        89%
// 1H     1440,720   94%, 87%

// The Karobein Oscillator has an intrinsic sinusoidal behaviour that helps in determining direction and timing.
// It does not repaint.
// original: alexgrover (https://www.tradingview.com/script/JiNi0f62-Karobein-Oscillator/)

scaleMinimax(X, p, min, max) => 
    hi = highest(X, p), lo = lowest(X, p)
    (max - min) * (X - lo)/(hi - lo) + min

price    = input(close,  "Price Data")
tf       = input(34,     "Timeframe", minval=1, maxval=1440)
thresh   = input(14.,    "Threshold", minval=.1, step=.1) 
div      = input(1000000,"Divisor", options=[1,10,100,1000,10000,100000,1000000,10000000,100000000])
showVol  = input(false,  "Volume")
useold   = input(true,   "Use Old System")

lime  = color.new(color.lime, 10), fuchsia = color.new(color.fuchsia, 10), 
black = color.new(color.black, 100), gray = color.new(color.gray, 50)

vol  = useold ? security(syminfo.tickerid, tostring(tf), volume, barmerge.gaps_off, barmerge.lookahead_on) 
              : security(syminfo.tickerid, tostring(tf), volume)
obv  = cum(change(price) > 0 ? vol : change(price) < 0 ? -vol : 0*vol)
prix = showVol ? obv : price
    
getdiff(prc, tf) =>
    prev  = useold ? security(syminfo.tickerid, tostring(tf), prc[1], barmerge.gaps_off, barmerge.lookahead_on) :
                     security(syminfo.tickerid, tostring(tf), prc[1])
    curr  = useold ? security(syminfo.tickerid, tostring(tf), prc, barmerge.gaps_off, barmerge.lookahead_on) : 
                     security(syminfo.tickerid, tostring(tf), prc)
    (curr/prev) - 1
    
p  = getdiff(prix, tf)
up = thresh/div, dn = -thresh/div
longCondition  = crossover(p, up)
shortCondition = crossunder(p, dn)

bg = longCondition ? lime : shortCondition ? fuchsia : black
cl = p > up ? color.green : p < dn ? color.red : color.silver

bgcolor(bg, editable=false)
plot(scaleMinimax(up, 2500, -1, 1), color=lime, editable=false, transp=0)
hline(0, linestyle=hline.style_dotted, title="base line", color=gray, editable=false)
plot(scaleMinimax(dn, 2500, -1, 1), color=fuchsia, editable=false, transp=0)
plot(scaleMinimax(p, 2500, -1, 1), color=cl, style=plot.style_histogram, transp=70, editable=false)
plot(scaleMinimax(p, 2500, -1, 1), color=cl, style=plot.style_linebr, title="prediction", transp=0, editable=false)

strategy.entry("L", true, 1, when=longCondition)
strategy.entry("S", false, 1, when=shortCondition)

alertcondition(longCondition, title='Long', message='Long Signal!')
alertcondition(shortCondition, title='Short', message='Short Signal!')

//*** Karobein Oscillator
per  = input(8, "Karobein Osc Lookback")

prix2  = ema(price, per)
a = ema(prix2 < prix2[1] ? prix2/prix2[1] : 0, per)
b = ema(prix2 > prix2[1] ? prix2/prix2[1] : 0, per)
c = (prix2/prix2[1])/(prix2/prix2[1] + b)
d = 2*((prix2/prix2[1])/(prix2/prix2[1] + c*a)) - 1

plot(scaleMinimax(d, 2500, -1, 1), color=color.orange, transp=0)