動的移動平均トレンドクロスオーバー戦略


作成日: 2023-11-21 17:18:20 最終変更日: 2023-11-21 17:18:20
コピー: 2 クリック数: 609
1
フォロー
1617
フォロワー

動的移動平均トレンドクロスオーバー戦略

概要

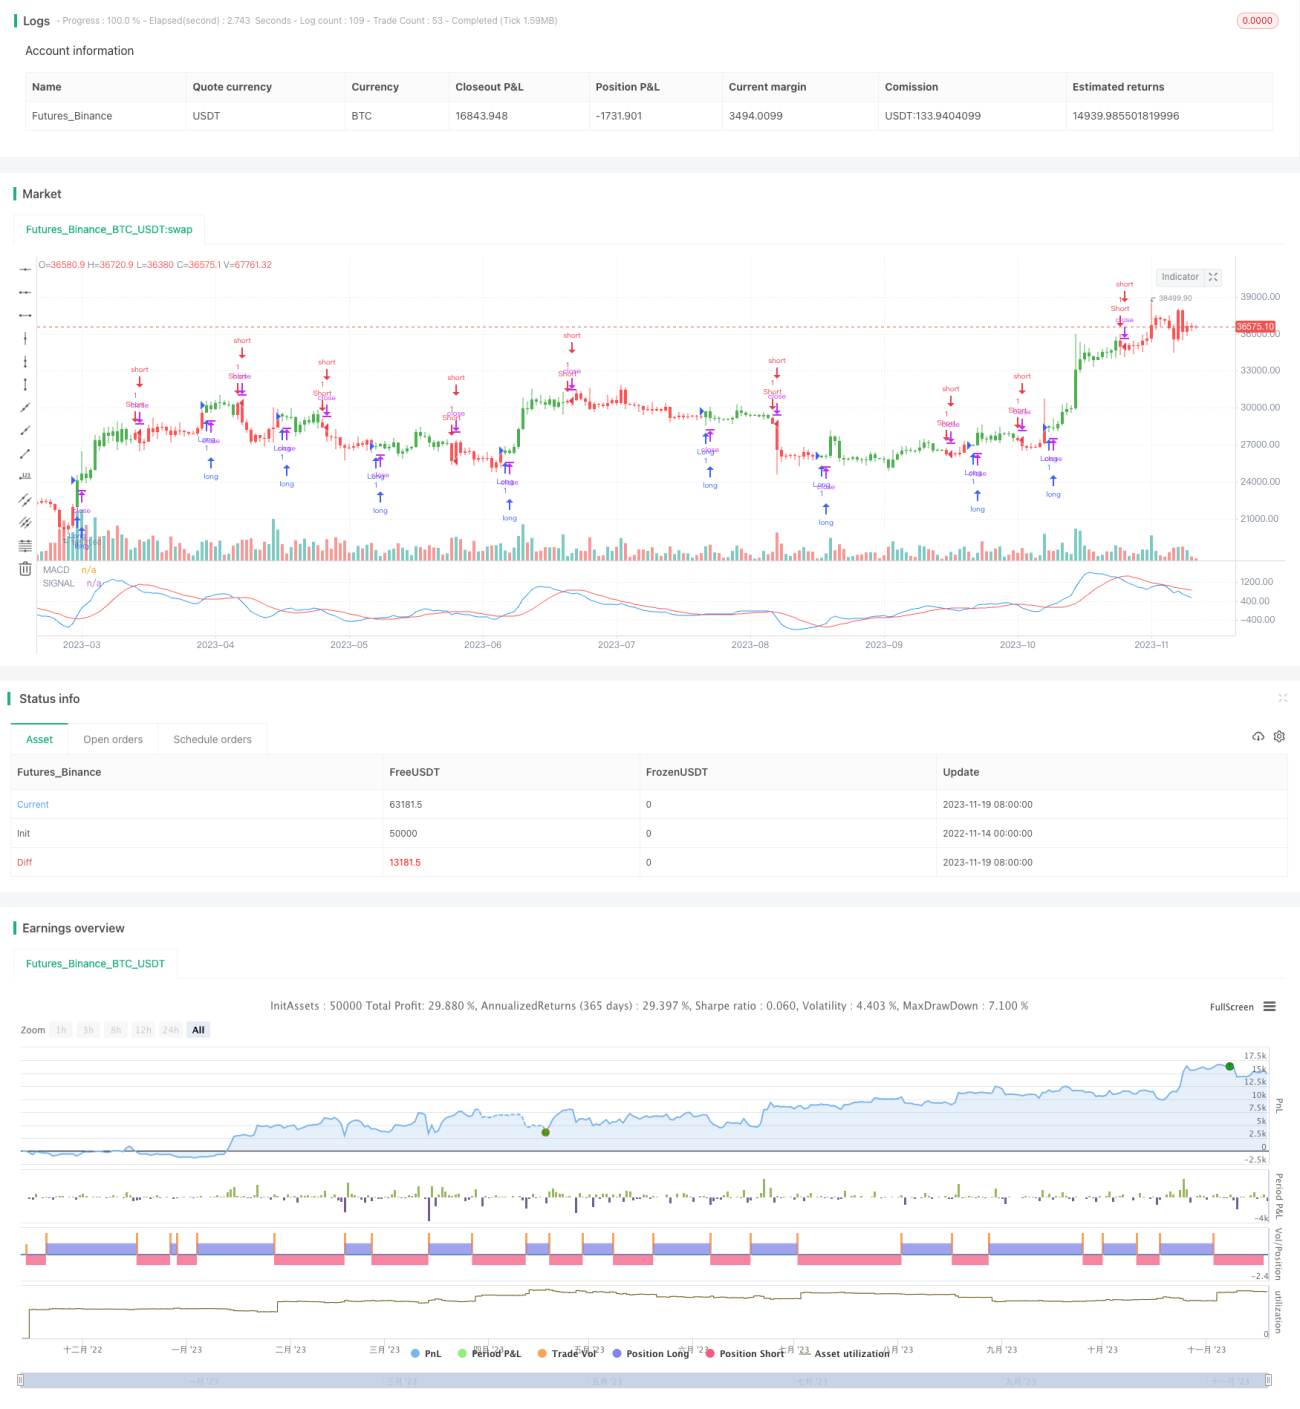
ダイナミック・均線トレンド・クロス戦略は,MACD (移動平均収束散布指数) をベースにした取引システムである.この戦略は,短期と長期の移動平均の差によって市場のトレンドを判断し,購入または売却の決定を行う.その主な考えは,短期と長期のトレンドの間の関係を監視することによって,市場の潜在的な変化を予測することです.

戦略原則

この戦略は,2つの異なる周期の指数移動平均 ((EMA) を使用します:急速なEMA (8日) と遅いEMA (16日).MACD値は,この2つのEMAの差値から構成されます.さらに,戦略は,MACDの単純な移動平均である信号線を導入します.

コードレベルでは,戦略はまず,迅速なEMAと遅いEMAを計算し,MACD値を得ます.その後,MACDのSMAを計算し,信号線として使用します.MACDと信号線の位置を比較することで,戦略は現在のポジションの状態を決定します.さらに,戦略は,逆の信号が現れたときに市場に入ることを可能にする逆転取引のオプションを提供します.

戦略的優位性

ダイナミック・均線トレンド・クロス戦略の主な優点は,その簡潔さと市場トレンドの変化に対する感受性にある.異なる周期のEMAを使用することにより,この戦略は,短期と長期のトレンドの間の偏差を効果的に捕捉することができ,それによって市場変化に間に合うように反応することができる.さらに,シグナルラインの追加は,戦略の精度をさらに高め,投資家がより早くトレンドの転換を認識できるようにする.

リスク分析

動的均線トレンドクロス戦略は,ほとんどの場合,良好なパフォーマンスを発揮しているものの,それにはいくつかのリスクがあります.最も主要なリスクは,市場の変動が大きい場合や傾向が明らかでない場合,この戦略が誤導的な信号を生む可能性があります.さらに,戦略が歴史的データに依存することは,遅延反応を引き起こす可能性があります.これらのリスクを軽減するために,投資家は,意思決定を支援するために,他の技術指標または市場分析と組み合わせることができます.

最適化の方向

この戦略の最適化方向は,主にEMA周期の長さを調整し,他の技術指標を導入し,市場変動要因を考慮する.調整周期の長さは,戦略を異なる市場条件により適応させる.RSI,ブリン帯などの他の指標を導入することは,より包括的な市場視点を提供できる.ATRによる取引戦略の調整などの市場変動要因を考慮することは,戦略の適応性と安定性を強化することができる.

要約する

ダイナミック・均線・トレンド・クロス・ストラテジーとは,MACDを中心とする量的な取引戦略である.短期と長期のトレンドの関係を分析することによって,市場の動きを把握する.この戦略は簡潔に有効であるが,その限界と潜在的なリスクにも注意する必要がある.継続的に最適化され,他の分析ツールと組み合わせることで,投資家はこの戦略をよりよく利用し,効果的な市場操作を実現することができる.

ストラテジーソースコード
/*backtest
start: 2022-11-14 00:00:00
end: 2023-11-20 00:00:00
period: 1d
basePeriod: 1h
exchanges: [{"eid":"Futures_Binance","currency":"BTC_USDT"}]
*/

//@version=2
////////////////////////////////////////////////////////////
//  Copyright by HPotter v1.0 06/09/2017
// MACD – Moving Average Convergence Divergence. The MACD is calculated 
// by subtracting a 26-day moving average of a security's price from a 
// 12-day moving average of its price. The result is an indicator that 
// oscillates above and below zero. When the MACD is above zero, it means 
// the 12-day moving average is higher than the 26-day moving average. 
// This is bullish as it shows that current expectations (i.e., the 12-day 
// moving average) are more bullish than previous expectations (i.e., the 
// 26-day average). This implies a bullish, or upward, shift in the supply/demand 
// lines. When the MACD falls below zero, it means that the 12-day moving average 
// is less than the 26-day moving average, implying a bearish shift in the 
// supply/demand lines.
// A 9-day moving average of the MACD (not of the security's price) is usually 
// plotted on top of the MACD indicator. This line is referred to as the "signal" 
// line. The signal line anticipates the convergence of the two moving averages 
// (i.e., the movement of the MACD toward the zero line).
// Let's consider the rational behind this technique. The MACD is the difference 
// between two moving averages of price. When the shorter-term moving average rises 
// above the longer-term moving average (i.e., the MACD rises above zero), it means 
// that investor expectations are becoming more bullish (i.e., there has been an 
// upward shift in the supply/demand lines). By plotting a 9-day moving average of 
// the MACD, we can see the changing of expectations (i.e., the shifting of the 
// supply/demand lines) as they occur.
//  You can change long to short in the Input Settings
//  WARNING:
//  - For purpose educate only
//  - This script to change bars colors.
////////////////////////////////////////////////////////////
strategy(title="MACD Crossover", shorttitle="MACD Crossover")
fastLength = input(8, minval=1)
slowLength = input(16,minval=1)
signalLength=input(11,minval=1)
reverse = input(false, title="Trade reverse")
// hline(0, color=purple, linestyle=dashed)
fastMA = ema(close, fastLength)
slowMA = ema(close, slowLength)
macd = fastMA - slowMA
signal = sma(macd, signalLength)
pos = iff(signal < macd , 1,
	   iff(signal > macd, -1, nz(pos[1], 0))) 
possig = iff(reverse and pos == 1, -1,
          iff(reverse and pos == -1, 1, pos))	   
if (possig == 1) 
    strategy.entry("Long", strategy.long)
if (possig == -1)
    strategy.entry("Short", strategy.short)	   	    
barcolor(possig == -1 ? red: possig == 1 ? green : blue )  
plot(signal, color=red, title="SIGNAL")
plot(macd, color=blue, title="MACD")