勢いとトレンド判断を組み合わせたマルチファクター定量取引戦略

1
Follow
1779
Followers
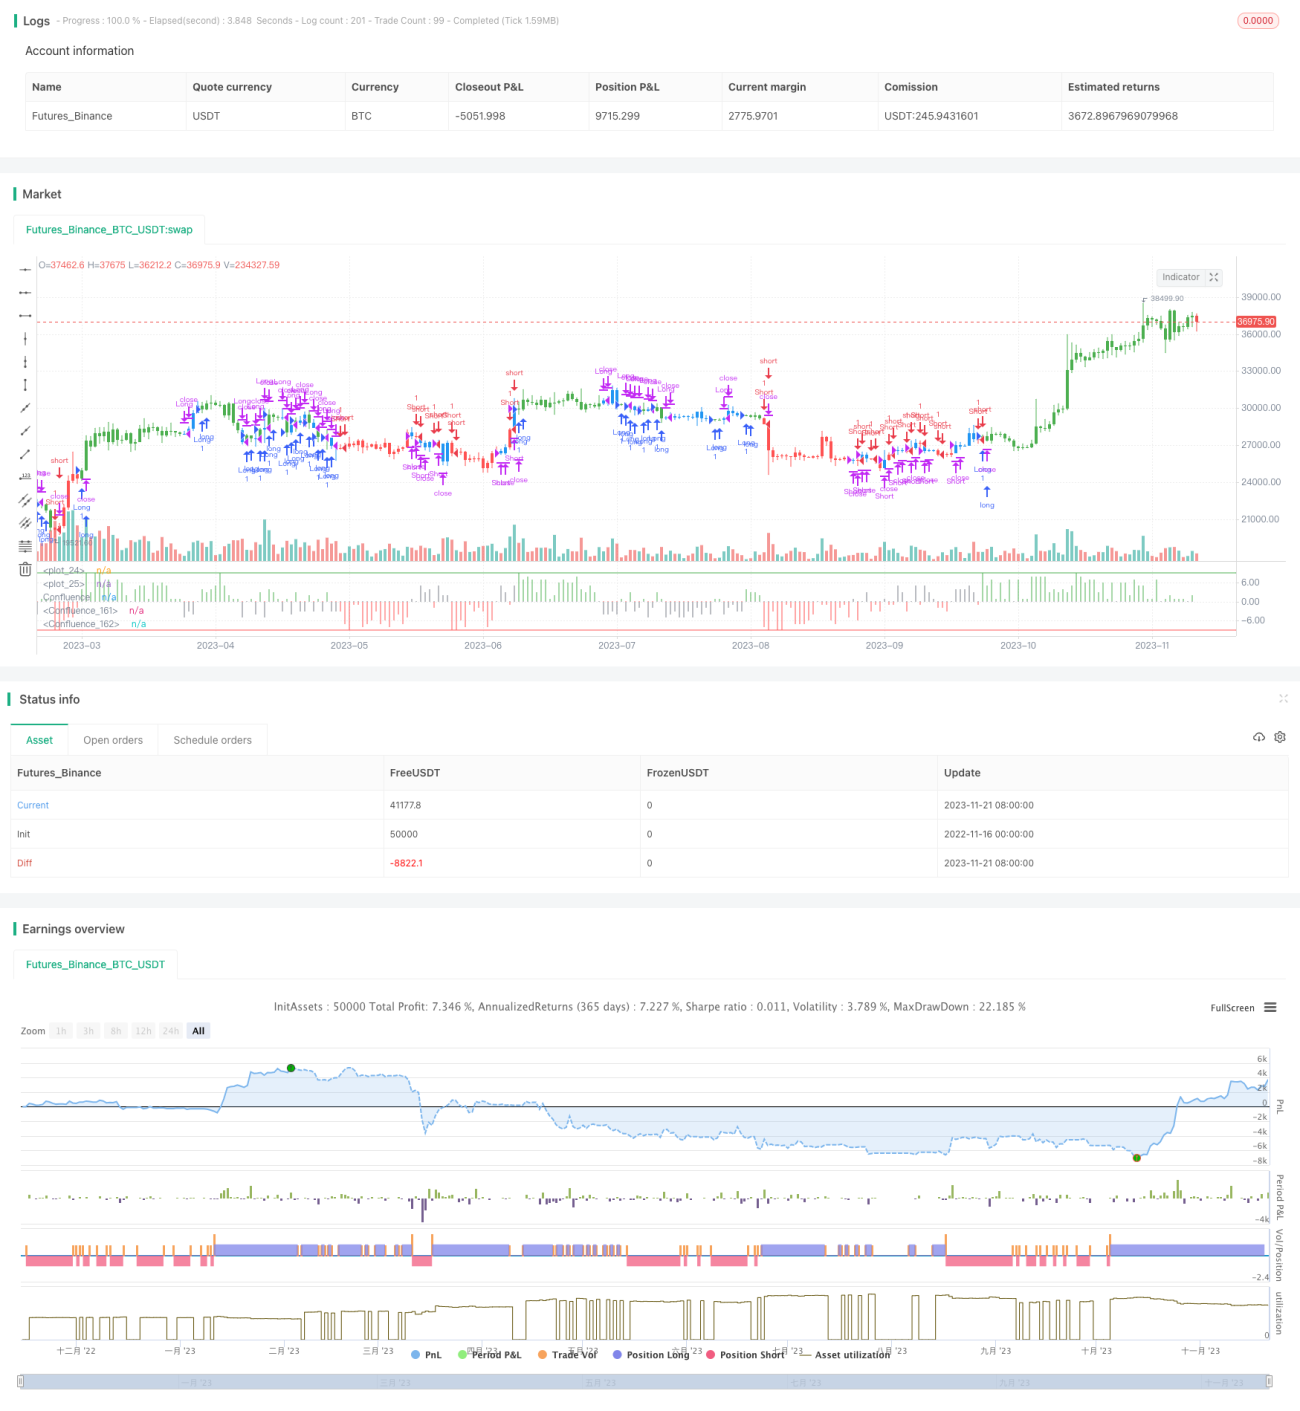
概要
この戦略は,動量指標とトレンド指標を組み合わせた多因判断型量化取引戦略である.戦略は,複数の平均の数学的な組み合わせを計算することによって,市場の全体的な傾向と動量方向を判断し,<unk>値条件に応じて取引シグナルを発信する.
戦略原則
- 複数のグループ平均と動量指標を計算する
- ハーモニクス平均,短期平均,中期平均,長期平均などの複数の平均を計算する
- 各平均値間の差を計算し,価格変化の傾向を反映する
- 各平均の1次導関数を計算し,価格変化の動態を反映する
- 弦<unk>指数を計算し,トレンドの方向を判断する
- 取引信号の総合判断
- 運動指数,トレンド指数などの複数の要因を重み付け操作
- この結果から,現在の市場状況を判断します.
- 複数の空白取引のシグナルを発信
優位分析
- 多要素判断により信号の精度が向上
- 価格,トレンド,動力の要素を総合的に考慮する
- 異なる重みで設定できます.
- パラメータを調整し,異なる市場に対応
- 平均値パラメータ,取引区間の境界はカスタム可能
- 周期や市場の状況に適応できる
- コード構造が明確で分かりやすい
- 命名規範,注釈完結
- 簡単に再開発し,最適化できます.
リスク分析
- パラメータを最適化するのは難しい
- 優れたパラメータを見つけるには,膨大な歴史データが必要になります.
- 取引頻度が高くなる可能性があります.
- 複数の要素を組み合わせて判断すると,過剰な取引が起こる可能性があります.
- 効果と市場との関連性
- 傾向を判断する戦略は 非理性的な行動に 影響されやすい
最適化の方向
- ストップダストロジック
- 理不尽な行動による大きな損失を回避する
- パラメータの設定を最適化
- 戦略の安定性を高めるための最適のパラメータの組み合わせを探し出す
- 機械学習の要素を追加する
- ディープ・ラーニングは,現在の市場状況を判断し,戦略的決定を支援します.
要約する
この戦略は,動量指標とトレンド指標の多因子組み合わせを使用して,市場の状態を判断し,設定された<unk>値に応じて取引信号を発信する.戦略の優点は,構成性が強く,異なる市場環境に適合し,容易に理解できることです.戦略の劣点は,パラメータの最適化が困難で,取引頻度は過度に高く,効果は市場に関連性が強いものです.将来,停止損失,パラメータの最適化および機械学習などの手段を追加することによってさらに最適化することができます.
Source
Pine
/*backtest
start: 2022-11-16 00:00:00
end: 2023-11-22 00:00:00
period: 1d
basePeriod: 1h
exchanges: [{"eid":"Futures_Binance","currency":"BTC_USDT"}]
*/

//@version=2
////////////////////////////////////////////////////////////
//  Copyright by HPotter v1.0 14/03/2017
// This is modified version of Dale Legan's "Confluence" indicator written by Gary Fritz.Strategy parameters
Related strategies
Comment
All comments (0)
No data
- 1