一目均衡表定量戦略
作成日:
2023-11-24 10:15:15
最終変更日:
2023-11-24 10:15:15
コピー:
3
クリック数:
854
1
フォロー
1751
フォロワー
概要
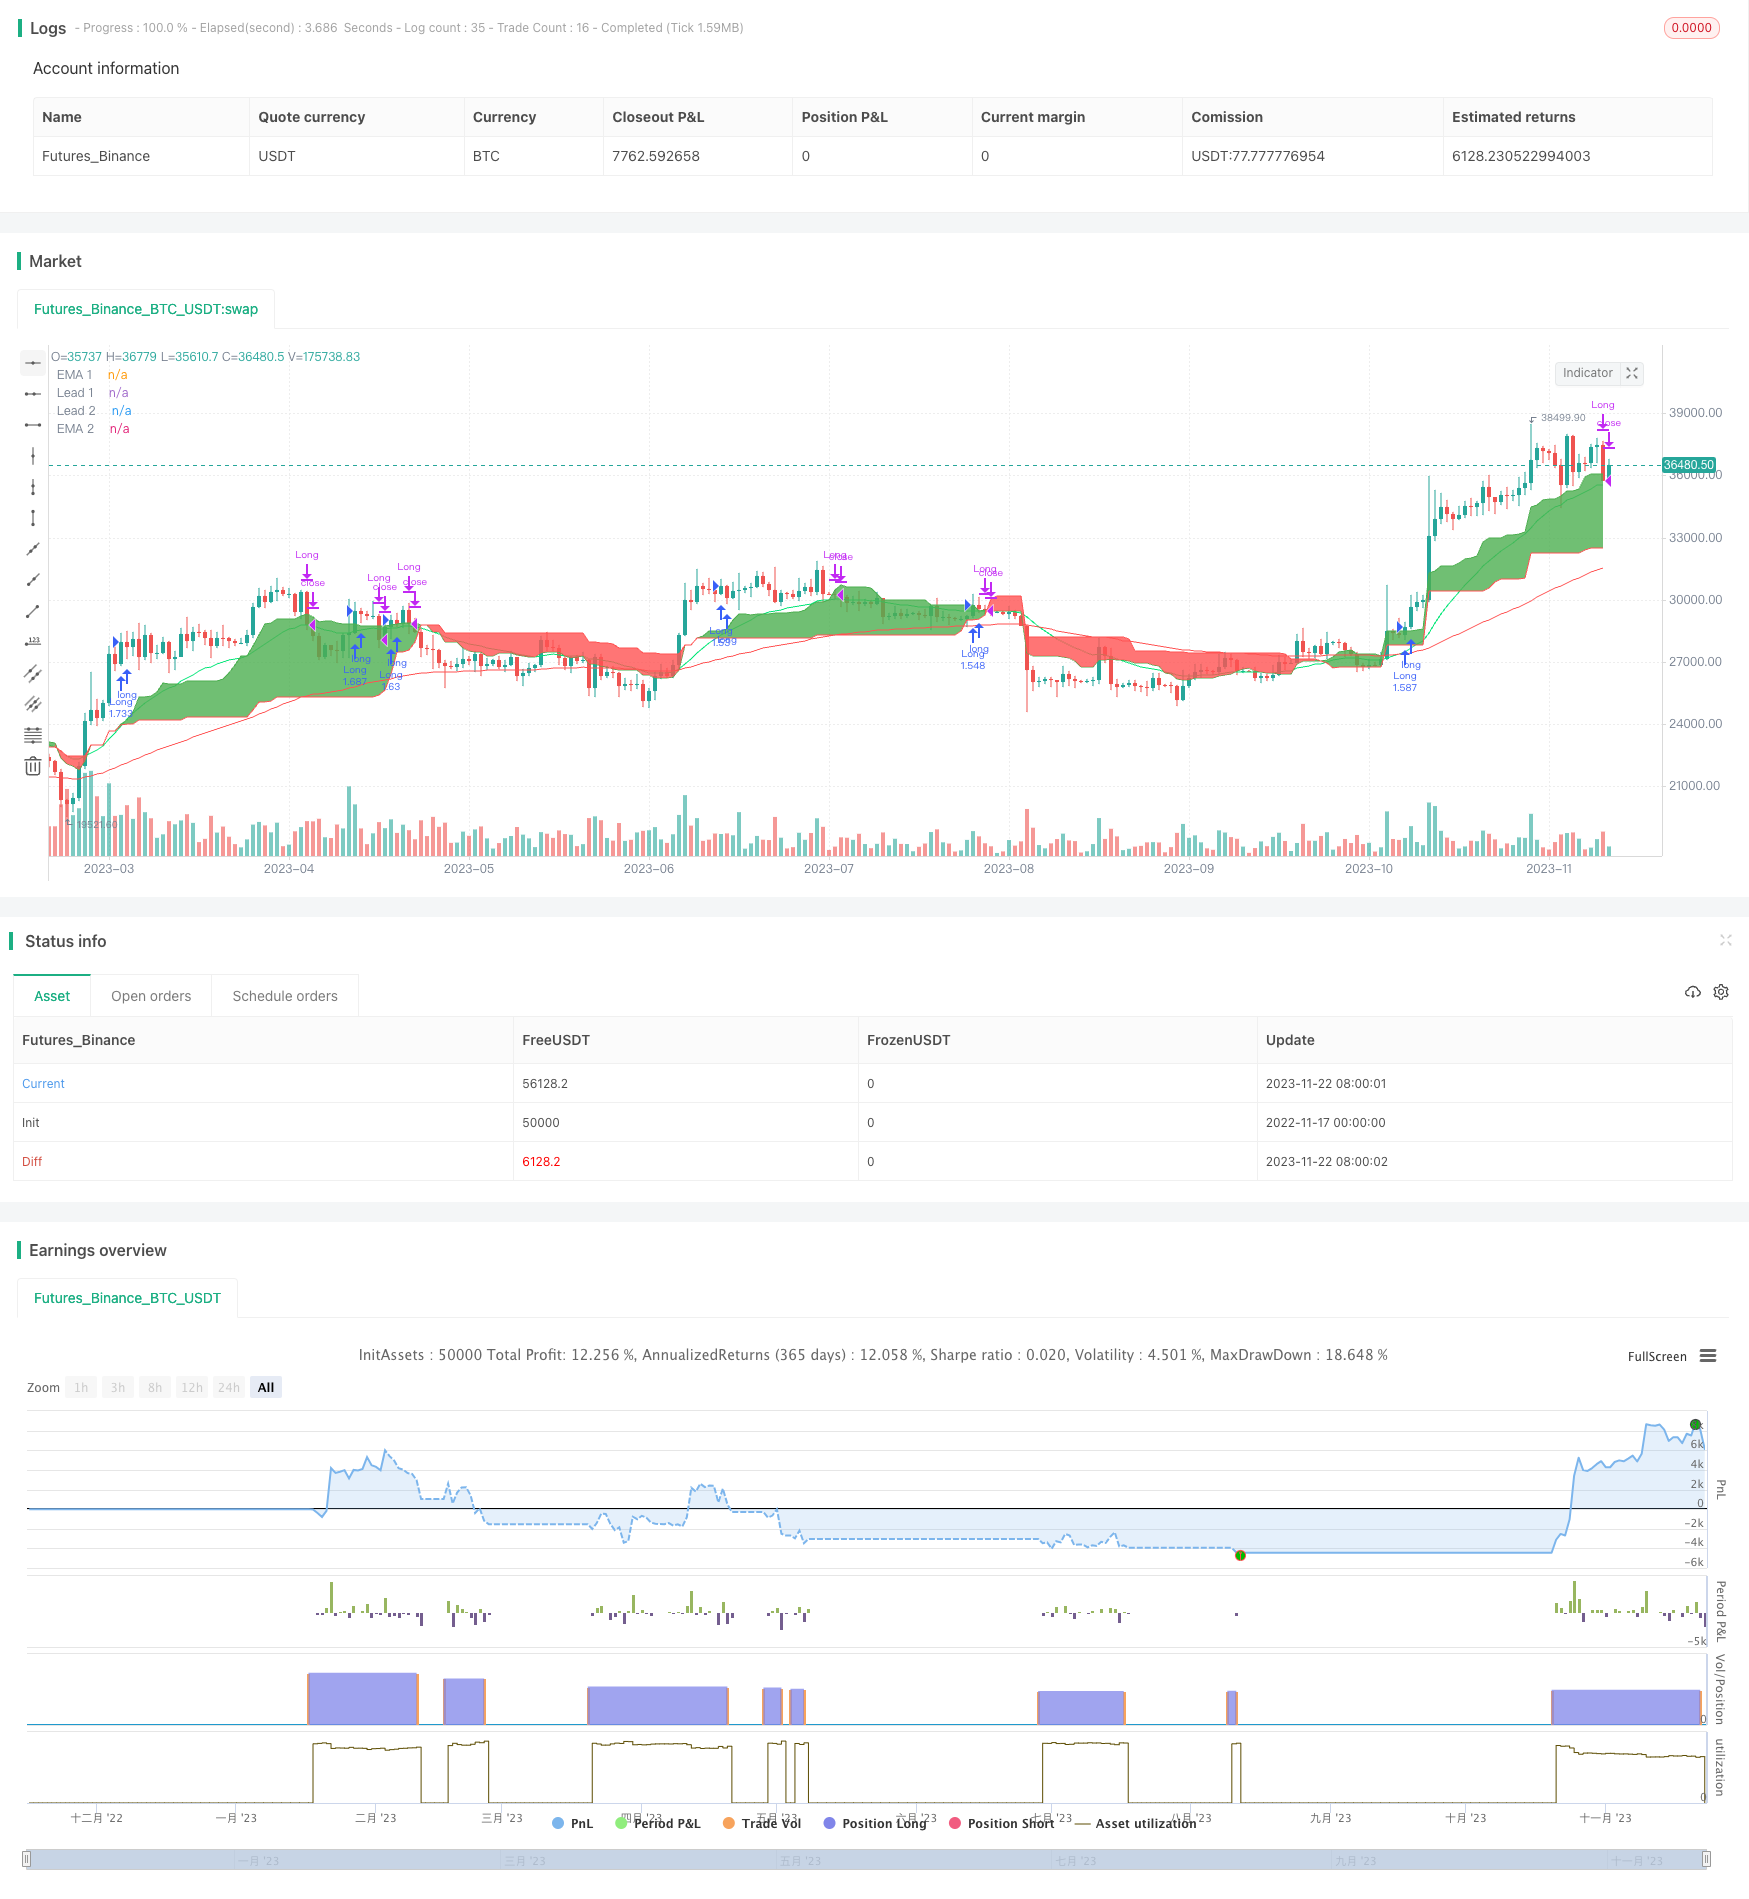
これは,単に多めにすることのイチモク雲の図量化策である. 策は,K線形,移動平均,およびストキャスティックRSI指標のフィルタリング信号を組み合わせて,トレンドの方向を判断するイチモク指標で,トレンドが上昇するときにより良い入場点を選択する多めにすることである.
戦略原則
この戦略の判断基準は以下の通りです.
- Ichimoku先導線1は先導線2を横切って,トレンドの転換を示している.
- K線 閉盤価格上での先導線1を横断し,トレンドを追跡する条件を満たす
- K線は陽線で,上昇傾向にある.
- 移動平均を有効にすると,速線を遅線に要求します.
- ストキャスティックRSIを有効にすると,K線をD線に突破するように要求します.
上記の条件が同時に満たされた場合,戦略は多額のポジションを開きます.価格が先導線1を下回ると,戦略は平仓を退場します.
この戦略は,主にIchimoku雲図を用いて主要なトレンドの方向を判断し,次に補助指標のフィルタリング信号と組み合わせて,トレンドが上昇する時に良い入場点を選択する.
戦略的優位性
- イチモク雲の図を用いて主動を判断し,その判断の精度が高いことが確認されています.
- 複数の補助指標を組み合わせて,入場ポイントをフィルターすることで,利益率を大幅に高めることができます.
- 複数の策略を用いることで,多頭行情の通貨を判断する
- パラメータ最適化スペースが広いので,指標パラメータをさらに最適化できます.
戦略リスク
- イチモク雲図の判断に失敗する可能性があり,トレンドの方向を誤って判断する可能性がある.
- ストップ・ロースが突破され,損失が拡大する可能性があります.
- 多頭形に設計され,形が変化の兆候を隠すには適さない通貨
- パラメータの設定が不適切である場合,過激な入場または過度に保守的な結果が出る
対策として
- 判断の正確さを向上させるための指標
- 合理的なストップポイントを設定し,単一損失を厳格に管理する
- 各通貨の状況に応じて適用する戦略の選択
- 戦略の安定性を高めるため,パラメータを慎重にテストし,最適化します.
戦略最適化の方向性
- 戦略の安定性をさらに高めるために,補助指標のパラメータ設定を最適化
- 追跡ストップ,指数移動平均ストップなど,追加したストップメカニズム
- 固定ポジション,ポジション平均などのポジション管理を追加する
- 特定の通貨のパラメータ調整最適化
要約する
このイチモク雲図量化戦略は,トレンドの方向を判断することで,高い勝率とリスクが制御できるだけの多頭策を単一策にする.戦略の優位性は明らかで,多頭行情で効果が顕著である.次のステップは,指標最適化,止損機構,ポジション管理などの面で改善され,戦略をより完善して安定させることができる.
ストラテジーソースコード
/*backtest
start: 2022-11-17 00:00:00
end: 2023-11-23 00:00:00
period: 1d
basePeriod: 1h
exchanges: [{"eid":"Futures_Binance","currency":"BTC_USDT"}]
*/

//@version=4

strategy(title="Ichimoku only Long Strategy", shorttitle="Ichimoku only Long", overlay = true, pyramiding = 0, calc_on_order_fills = false, commission_type =  strategy.commission.percent, commission_value = 0, default_qty_type = strategy.percent_of_equity, default_qty_value = 100, initial_capital=10000, currency=currency.USD)

// Time Range
FromMonth=input(defval=1,title="FromMonth",minval=1,maxval=12)
FromDay=input(defval=1,title="FromDay",minval=1,maxval=31)
FromYear=input(defval=2017,title="FromYear",minval=2017)
ToMonth=input(defval=1,title="ToMonth",minval=1,maxval=12)
ToDay=input(defval=1,title="ToDay",minval=1,maxval=31)
ToYear=input(defval=9999,title="ToYear",minval=2017)
start=timestamp(FromYear,FromMonth,FromDay,00,00)
finish=timestamp(ToYear,ToMonth,ToDay,23,59)
window()=>true
// See if this bar's time happened on/after start date
afterStartDate = time >= start and time<=finish?true:false

//Enable RSI
enableema = input(true, title="Enable EMA?")
enablestochrsi = input(false, title="Enable Stochastik RSI?")

//EMA
emasrc = close,
len1 = input(24, minval=1, title="EMA 1")
len2 = input(90, minval=1, title="EMA 2")

ema1 = ema(emasrc, len1)
ema2 = ema(emasrc, len2)

col1 = color.lime
col2 = color.red

//EMA Plots
plot(ema1, title="EMA 1", linewidth=1, color=col1)
plot(ema2, title="EMA 2", linewidth=1, color=col2)

//STOCH RSI
smoothK = input(3, minval=1, title="RSI K Line")
smoothD = input(3, minval=1, title="RSI D Line")
lengthRSI = input(14, minval=1, title="RSI Length")
lengthStoch = input(14, minval=1, title="Stochastik Length")
src = input(close, title="RSI Source")

rsi1 = rsi(src, lengthRSI)
k = sma(stoch(rsi1, rsi1, rsi1, lengthStoch), smoothK)
d = sma(k, smoothD)

//Ichimoku
conversionPeriods = input(9, minval=1, title="Ichi Conversion Line Length")
basePeriods = input(26, minval=1, title="Ichi Base Line Length")
laggingSpan2Periods = input(52, minval=1, title="Ichi Lagging Span 2 Length")
displacement = input(1, minval=0, title="Ichi Displacement")
donchian(len) => avg(lowest(len), highest(len))
conversionLine = donchian(conversionPeriods)
baseLine = donchian(basePeriods)
leadLine1 = avg(conversionLine, baseLine)
leadLine2 = donchian(laggingSpan2Periods)
p1 = plot(leadLine1, offset = displacement - 1, color=color.green,
	 title="Lead 1")
p2 = plot(leadLine2, offset = displacement - 1, color=color.red,
	 title="Lead 2")
fill(p1, p2, color = leadLine1 > leadLine2 ? color.green : color.red)


//Long Condition
crossup = k[0] > d[0] and k[1] <= d[1]
ichigreenabovered = leadLine1 > leadLine2
ichimokulong = close > leadLine1
greencandle =  close > open
redcandle = close < open
emacond = ema1 > ema2
longcondition = ichigreenabovered and ichimokulong and greencandle

//Exit Condition
ichimokuexit = close < leadLine1

exitcondition = ichimokuexit and redcandle

//Entrys

if (enablestochrsi == false) and (enableema == false) and (longcondition) and (afterStartDate) and (strategy.opentrades < 1)
    strategy.entry("Long", strategy.long)

if (enablestochrsi == true) and (enableema == false) and (longcondition) and (crossup) and (afterStartDate) and (strategy.opentrades < 1)
    strategy.entry("Long", strategy.long)

if (enableema == true) and (enablestochrsi == false) and (longcondition) and (emacond) and (afterStartDate) and (strategy.opentrades < 1)
    strategy.entry("Long", strategy.long)

if (enableema == true) and (enablestochrsi == true) and (longcondition) and (emacond) and (crossup) and (afterStartDate) and (strategy.opentrades < 1)
    strategy.entry("Long", strategy.long)


//Exits
if (afterStartDate)
    strategy.close(id = "Long", when = exitcondition)