ボリュームと価格指標に基づくロングショートバランス取引戦略
概要
この戦略は,複数のタイムフレームの量指数取引戦略である.この戦略は,相対的に強い弱い指数 (RSI),平均リアル波幅 (ATR),単純な移動平均 (SMA),およびカスタマイズされた量価格条件を組み合わせて,潜在的な多額のシグナルを識別する.この戦略は,特定のオーバーセール,量指数交差,価格突破などの条件を満たしたときに多額のポジションを確立する.同時に,各リスクと利益の比率を制御するストップ・ロスとストップ・ロップを設定する.
戦略原則
この戦略は以下のポイントを中心に展開されています.
- RSIが超売りラインより下にあり,最近10Kラインで連続的に超売り状態にあるときは,超売り信号とみなされる
- 量値条件の複数組を定義し,これらの量値条件を同時に満たす必要があり,量値指標が複数の信号を発信していると考えられる
- 閉店価格が13サイクルSMAを下から上へと突破すると,価格の突破信号として見られる.
- ATR小周期は大周期より低いことも助力信号である.
- 上記の複数の指標信号を統合して,最終的に複数の意思決定を形成します.
具体的には,この策略は,RSI指標に長さと超売りラインパラメータを設定し,これらのパラメータに基づいてRSI値を計算する. RSI指標が超売りラインより連続した多行K線を下回ると,超売り信号が生じます.
さらに,この戦略は3つの取引量値を定義し,異なる時間周期のデータに基づいて,複数の量値条件を設定する.例えば,90周期の量値は49周期の量値の1.5倍大である.これらの量値条件が同時に満たされると,量値指標の多行信号を発する.
価格に関しては,この戦略は13サイクルSMA指標を計算し,価格がSMAを突破して以来のK線の数を統計する.価格がSMAを下から上へと突破し,突破後にK線の数が5本未満であるときは,価格の突破信号とみなされる.
ATR周期パラメータに関しては,この戦略は小周期5と大周期14のATRを指定している.小周期ATRが大周期ATRより低いときは,市場の波動が加速縮小することを示す,助力された多做信号である.
最終的に,この戦略は,上記の複数の買い条件を総合的に考慮し,超売り,量値指数,価格突破,ATR指数を含む.これらの条件が同時に満たされると,最終的な多取引シグナルが生み出され,多取引ポジションが確立される.
戦略的優位性
この戦略には以下の利点があります.
多時間枠量価指標判断,精度向上 策略は単一周期の量価データを考慮するだけでなく,複数の異なる周期量価条件の交差状況を評価し,量力の集中度をより正確に判断することができる.
超売り+量価格+価格の三重判断機構は,買取信号の信頼性を確保する.超売りは,最も基本的な買取タイミングの選択を提供する.さらに,量価格と価格の指標の交差は,買取タイミングに追加の確認を加え,信頼性が高くなる.
ストップ・ストップ・メカニズムを設定し,単一取引のリスクを厳格に制御する. ストップ・ストップ・パラメータは,個人リスクの好みに合わせて調整することができ,利益の最大化を追求しながら,単一のリスクを合理的に制御する.
多指標統合判断により弾力性が向上する.一部の指標が故障または誤りが発生しても,他の指標の判断によって一定の継続的機能が保証される.
リスクと対策
この戦略にはいくつかのリスクがあります.
パラメータ配置リスク. 各種指標のパラメータ設定は判断結果に直接影響し,不合理なパラメータは取引信号の偏差を引き起こす可能性がある. 慎重に検証するパラメータの合理的な取値が必要である.
利益の余地は限られている.複数の指標を融合して統合判断を行う戦略として,信号発生頻度は比較的保守であり,単位時間における取引回数は少ない.利益の余地には一定の限界がある.
指数発散リスク.一部の指標が多調信号を発し,他の指標が空調信号を発する時,戦略は最適な決定を決定することができない.これは,指標間での潜在的な散乱を事前に識別し,解決する必要がある.
戦略最適化の方向性
この戦略は,以下の点でさらに最適化できます.
機械学習モデルの補助判断を追加する. 量値と波動特性のモデルを訓練し,人工で設定されたパラメータを補助し,パラメータの動態化を実現する.
ストップ戦略の成熟度を高めること.例えば,浮動ストップ,分量ストップ,ストップを追跡するなど,オフ期を防止しながら,単一収益をさらに高めることができる.
入札口データを評価する.K線量値データに加えて,深層取引口データと組み合わせて,保有分布を判断し,追加の参考信号を提供することができる.
他の指標の統合をテストする.この戦略は,RSI,ATR,SMAなどの指標を統合するために使用します.また,ブリンライン,KDJなどの他の指標の組み合わせを導入し,取引信号源を豊かにして最適化することもできます.
要約する
この戦略は,RSI,ATR,SMAおよびカスタム価格条件判断を総合的に使用して,潜在的に多時的な取引の識別を実現する.それは同時に,複数の時間枠の量価格指標判断,三重信号確認機構およびストップ・ストップ・リスクの制御などの優位性を持っています.もちろん,パラメータ配置リスク,利益スペースの制限などの問題にも注意する必要があります.将来,この戦略は,機械学習補助,ストップ・ストップ戦略の最適化,取引口データの導入および指標の統合拡張などからさらに最適化することができます.
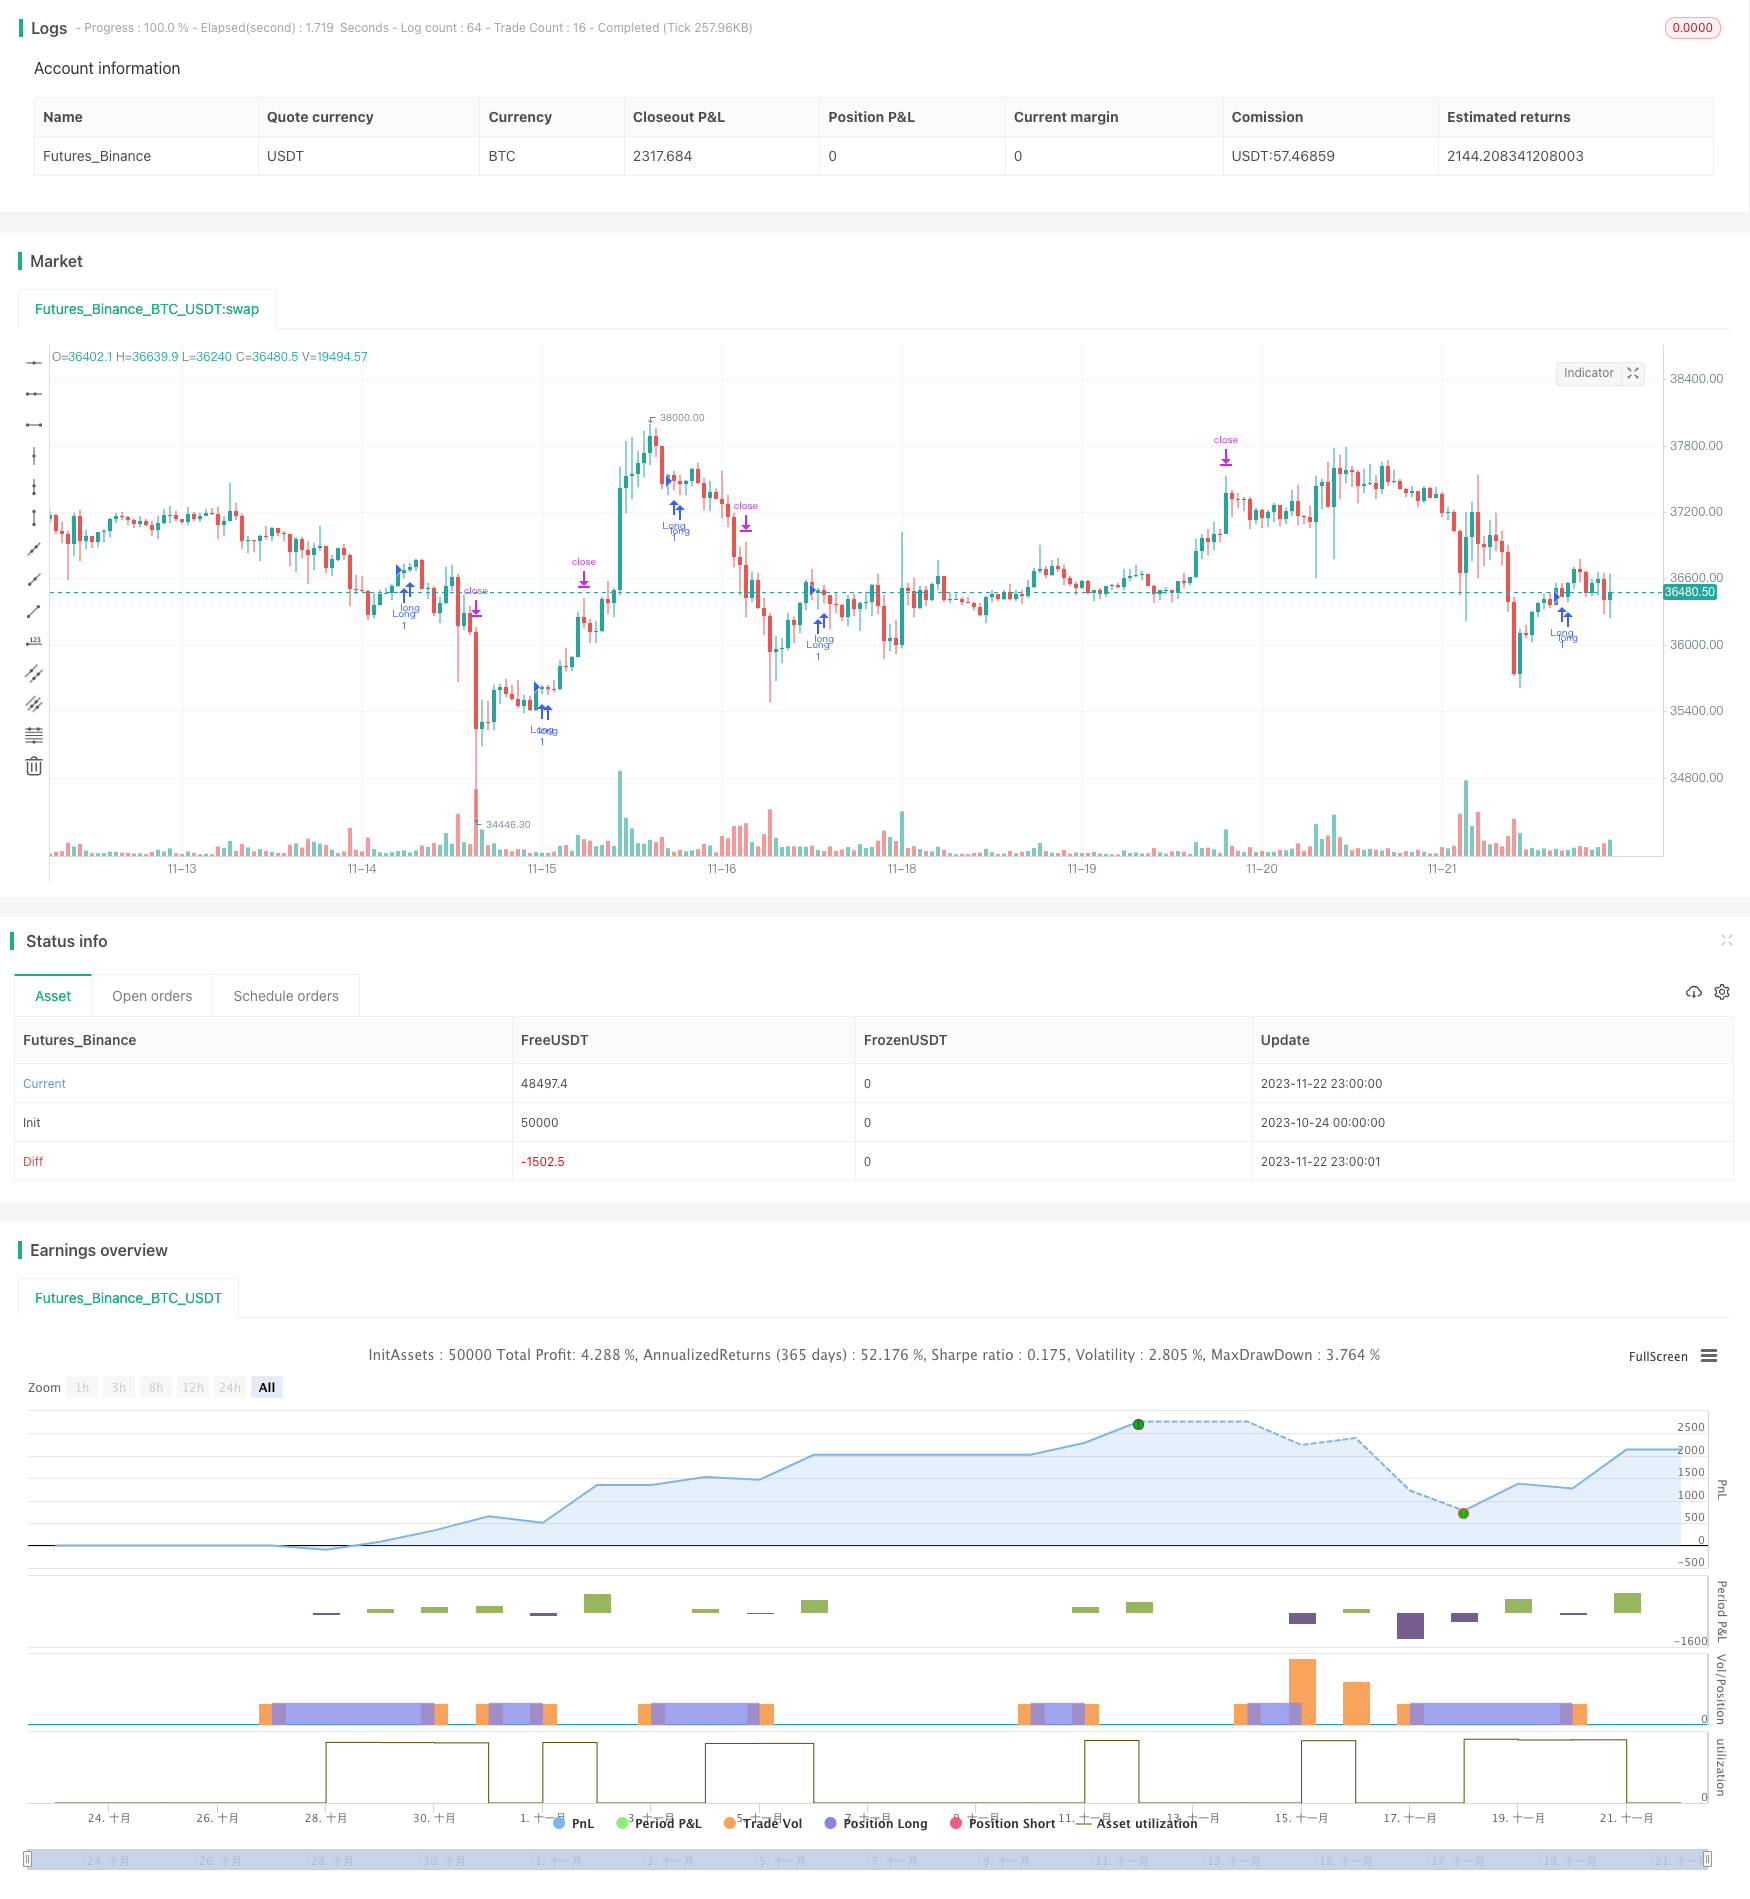
/*backtest
start: 2023-10-24 00:00:00
end: 2023-11-23 00:00:00
period: 1h
basePeriod: 15m
exchanges: [{"eid":"Futures_Binance","currency":"BTC_USDT"}]
*/

// © Kimply_Tr
//@version=5

// Strategy settings and parameters
strategy(title='Volume ValueWhen Velocity', overlay=true)

// Define the stop-loss and take-profit percentages for the long strategy
long_stoploss_value = input.float(defval=3, title='Stop-Loss (SL) %', minval=0, group='▶ Stop Loss/Take Profit => Long-Strategy', inline='2')
long_stoploss_percentage = close * (long_stoploss_value / 100) / syminfo.mintick  // Calculate long stop-loss percentage
long_takeprofit_value = input.float(defval=2, title='Take-Profit (TP) %', minval=0, group='▶ Stop Loss/Take Profit => Long-Strategy', inline='2')
long_takeprofit_percentage = close * (long_takeprofit_value / 100) / syminfo.mintick  // Calculate long take-profit percentage

// Define parameters related to ValueWhen occurrences
occurrence_ValueWhen_1 = input.int(title='occurrence_ValueWhen_1', defval=1, maxval=100, step=1, group="▶ ValueWhen",tooltip ="Its value must be smaller than (occurrence_ValueWhen_2)")
occurrence_ValueWhen_2 = input.int(title='occurrence_ValueWhen_2', defval=5, maxval=100, step=1, group="▶ ValueWhen" ,tooltip="Its value must be greater than (occurrence_ValueWhen_1)")
distance_value=input.int(title='distance_value_occurrence', defval=170, maxval=5000, step=1, group="▶ ValueWhen" ,tooltip="It indicates the minimum distance between the occurrences of 1 and 2, i.e. the difference between the occurrences of 1 and 2 is greater than (distance_value_occurrence)")

// Define RSI-related parameters
rsi_over_sold = input.int(defval=60, minval=1, title='Oversold Level', group='▶ RSI',inline ='2')  // Input for oversold level in RSI
rsi_length = input.int(defval=40, minval=1, title='RSI Length', group='▶ RSI',inline ='2')  // Input for RSI length
rsi = ta.rsi(close, rsi_length)  // Calculate RSI

// Define volume thresholds
volume_threshold1 = input.float(title='volume_threshold_1', defval=0.5, maxval=10, step=0.1, group="▶ Volume")
volume_threshold2 = input.float(title='volume_threshold_2', defval=0.4, maxval=10, step=0.1, group="▶ Volume")
volume_threshold3 = input.float(title='volume_threshold_3', defval=0.62, maxval=10, step=0.1, group="▶ Volume")

// ATR (Average True Range)
// Define ATR parameters
atr_small = input.int(title='ATR_Small', defval=5, maxval=500, step=1, group="▶ Atr",inline ='2')
atr_big = input.int(title='ATR_Big ', defval=14, maxval=500, step=1, group="▶ Atr",inline ='2')

atr_value3 = ta.atr(15)  // Calculate ATR value 3
////////////////////////////////////////////////////////////////////////////////////////////////////////////////////////
// Date Range
// Define the date range for back-testing
start_date = input.int(title='Start Day', defval=1, minval=1, maxval=31, group='▶ Time-Period for Back-Testing', inline='1')  // Input for start day
end_date = input.int(title='until Day', defval=1, minval=1, maxval=31, group='▶ Time-Period for Back-Testing', inline='1')  // Input for end day
start_month = input.int(title='Start Month', defval=7, minval=1, maxval=12, group='▶ Time-Period for Back-Testing', inline='2')  // Input for start month
end_month = input.int(title='until Month', defval=1, minval=1, maxval=12, group='▶ Time-Period for Back-Testing', inline='2')  // Input for end month
start_year = input.int(title='Start Year', defval=2022, minval=1800, maxval=3000, group='▶ Time-Period for Back-Testing', inline='3')  // Input for start year
end_year = input.int(title='until Year', defval=2077, minval=1800, maxval=3000, group='▶ Time-Period for Back-Testing', inline='3')  // Input for end year
in_date_range = time >= timestamp(syminfo.timezone, start_year, start_month, start_date, 0, 0) and time < timestamp(syminfo.timezone, end_year, end_month, end_date, 0, 0)  // Check if the current time is within the specified date range
////////////////////////////////////////////////////////////////////////////////////////////////////////////////////////
was_over_sold = ta.barssince(rsi <= rsi_over_sold) <= 10  // Check if RSI was oversold in the last 10 bars
////////////////////////////////////////////////////////////////////////////////////////////////////////////////////////
getVolume(symbol, bar) =>
    request.security(syminfo.tickerid, "D", volume)[bar]  // Function to get volume data for a specific symbol and bar

getVolume2(symbol, bar) =>
    request.security(syminfo.tickerid, "39", volume)[bar]  // Function to get volume data for a specific symbol and bar 2
////////////////////////////////////////////////////////////////////////////////////////////////////////////////////////

firstCandleColor1 = request.security(syminfo.tickerid, "D", close[2] > open[1] ? 1 : 0)
firstCandleColor2 = request.security(syminfo.tickerid, "1", close[2] > open[0] ? 1 : 0)
firstCandleColor3 = request.security(syminfo.tickerid, "W", close[1] > open[1] ? 1 : 0)

firstCandleColor= ((firstCandleColor1+firstCandleColor2)) > firstCandleColor3 ? 1 : 0

////////////////////////////////////////////////////////////////////////////////////////////////////////////////////////
sma = ta.sma(close, 13)  // Calculate the simple moving average (SMA) of the close price over 13 periods
numCandles = ta.barssince(close > sma)  // Count the number of candles since the close price crossed above the SMA
atr1=request.security(syminfo.tickerid, "30", ta.atr(atr_small)<ta.atr(atr_big))  // Get the ATR value for the specific security and timeframe (30 minutes) and check if ATR_small is less than ATR_big

prevClose = ta.valuewhen(close > sma, close, occurrence_ValueWhen_1)  // Get the close price when it first crosses above the SMA based on occurrence_ValueWhen_1
prevCloseBarsAgo = ta.valuewhen(close > sma, close, occurrence_ValueWhen_2)  // Get the close price when it first crosses above the SMA based on occurrence_ValueWhen_2
prevCloseChange =  (prevCloseBarsAgo - prevClose )  // Calculate the change in the close price between the occurrences of crossing above the SMA

atrval=(atr_value3>140) or (atr_value3 < 123)  // Check if atr_value3 is either greater than 140 or less than 123

Condition =  getVolume(syminfo.tickerid, 90) > volume_threshold1 * getVolume(syminfo.tickerid, 49)   and getVolume(syminfo.tickerid, 110) > volume_threshold3 * getVolume(syminfo.tickerid, 49)  and getVolume2(syminfo.tickerid, 30) > volume_threshold2 * getVolume2(syminfo.tickerid, 55) and getVolume2(syminfo.tickerid, 7) > volume_threshold2 * getVolume2(syminfo.tickerid, 3)  // Check multiple volume conditions

buy_signal=Condition  and atrval and firstCandleColor==0 and  was_over_sold and  prevCloseChange> distance_value and atr1 and  numCandles<5  // Determine if the buy signal is generated based on various conditions

////////////////////////////////////////////////////////////////////////////////////////////////////////////////////////
// Long Strategy
// Enter long position if the buy signal conditions are met and within the specified date range
if buy_signal and in_date_range
    strategy.entry('Long', strategy.long, alert_message='Open Long Position')  // Enter long position
    strategy.exit('Long SL/TP', from_entry='Long', loss=long_stoploss_percentage, profit=long_takeprofit_percentage, alert_message='Your SL/TP-Limit for the Long-Strategy has been activated.')  // Exit long position with stop-loss and take-profit