逆キャプチャ戦略


作成日: 2023-11-24 16:43:25 最終変更日: 2023-11-24 16:43:25
コピー: 0 クリック数: 678
1
フォロー
1621
フォロワー

逆キャプチャ戦略

概要

逆転キャプチャ戦略は,波動率指数ブリンラインと動態指数RSIを組み合わせた逆転取引戦略である.それは,ブリンラインチャネルとRSIの超買い超売りラインを信号として設定し,トレンドの方向が変化するときに逆転の機会を探して取引する.

戦略原則

この戦略は,ブリンラインを主要技術指標として使用し,RSIなどの動態指標を付加して取引シグナルを検証する.具体的論理は:

  1. 大周期トレンドの方向を判断し,看板か看板かを決定する.50日EMAと21日EMAの金叉死叉を用いて判断する.
  2. ダウントレンドでは,価格上昇がブリン下位を突破し,RSIが超売り区域から反発したばかりのときに,金叉形が現れ,超売り区域が底をついたことを示し,買取シグナルとして判断する.
  3. 上昇傾向では,価格下落がブリンを突破し,RSI指標がちょうど超買い区域から戻ったときに,デッドフォークの形が現れ,超買い領域が回調し始めていることを示し,売り信号であると判断する.
  4. 偽の信号を避けるために,上記の買取と販売の信号は同時に満たされなければなりません.

優位分析

この戦略の利点は以下の通りです.

  1. 波動率指標と運動量指標を組み合わせると,信号はより信頼性が高い.
  2. 逆転取引はリスクが低く,ショートライン操作に適している.
  3. プログラム化規則が明確で,自動取引が容易に実現される.
  4. 動いている市場での無秩序なポジションを避けるために,トレンド取引を組み合わせる.

リスク分析

この戦略には以下のリスクもあります.

  1. ブリンラインチャネルは,偽信号の危険を突破し,RSI指標をフィルタリングする必要があります.
  2. 逆転の失敗の危険性があるため, 早期に止めておく必要があります.
  3. 逆転のタイミングを把握できないリスクがあり,早めに入場したり,ベストポイントを逃したりする可能性があります.

上記のリスクに合わせて,リスク口を制御するためにストップロスを設定し,同時にパラメータを最適化し,ブリンライン周期またはRSIパラメータを調整できます.

最適化の方向

この戦略は以下の方向から最適化できます.

  1. ブリン帯のパラメータを最適化し,周期長と標準差の大きさを調整し,最適なパラメータ組み合わせを探します.
  2. 移動平均の周期を最適化し,トレンド判断の最適な周期長さを決定する.
  3. RSIパラメータを調整して,最適な超買超売り領域の範囲を探します.
  4. KDJ,MACDなどの他の指標の組み合わせを追加し,システム入場理由を豊かにする.
  5. 機械学習のアルゴリズムを追加し,AI技術を活用して最適なパラメータを自動的に探す.

要約する

逆転キャプチャ戦略は,全体として効果が優れているショートライン取引戦略である.それは,トレンド判断と逆転信号を組み合わせて,揺れ動いている市場の偽信号をフィルターすることができ,トレンド市場とトレンドの為替を回避でき,リスクは制御できる.パラメータとモデルを継続的に最適化することによって,より良い戦略効果を得ることができる.

ストラテジーソースコード
/*backtest
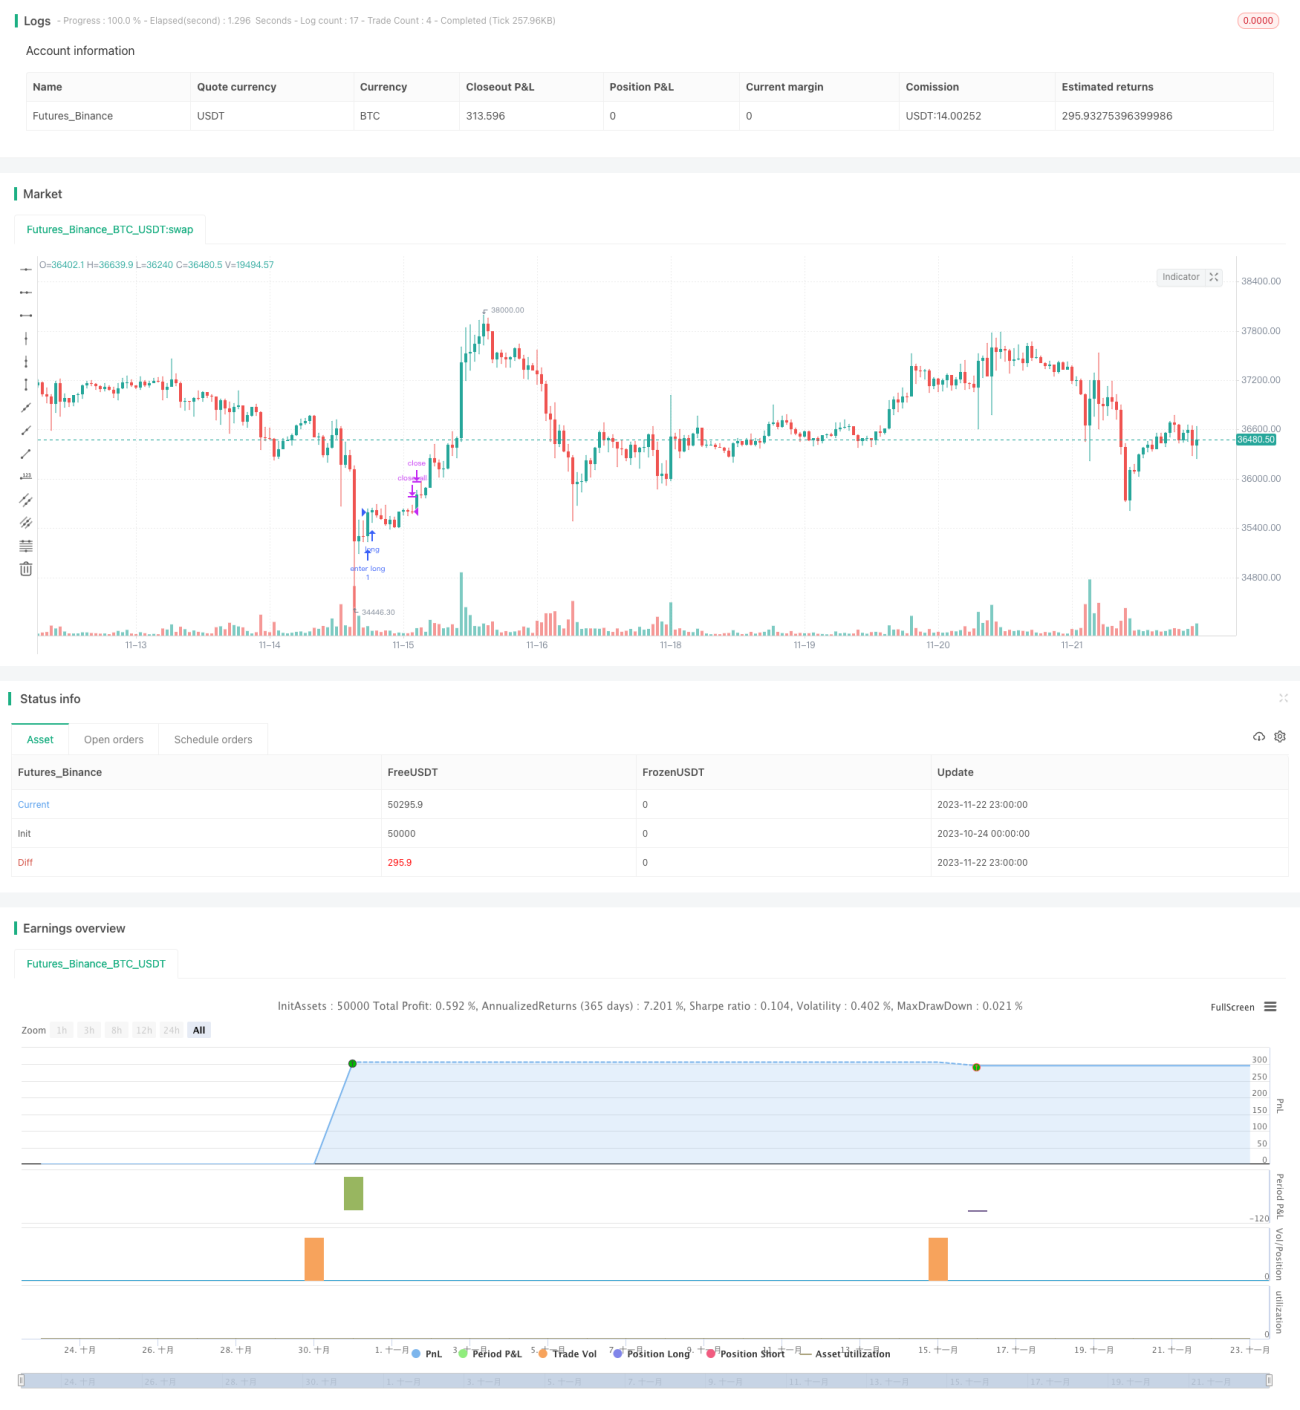
start: 2023-10-24 00:00:00
end: 2023-11-23 00:00:00
period: 1h
basePeriod: 15m
exchanges: [{"eid":"Futures_Binance","currency":"BTC_USDT"}]
*/

// This is an Open source work. Please do acknowledge in case you want to reuse whole or part of this code.
// Please see the documentation to know the details about this.

//@version=5
strategy('Strategy:Reversal-Catcher', shorttitle="Reversal-Catcher", overlay=true , currency=currency.NONE, initial_capital=100000)

// Inputs
src = input(close, title="Source (close, high, low, open etc.")

BBlength = input.int(defval=20, minval=1,title="Bollinger Period Length, default 20")
BBmult = input.float(defval=1.5, minval=1.0, maxval=4, step=0.1, title="Bollinger Bands Standard Deviation, default is 1.5")

fastMovingAvg = input.int(defval=21, minval=5,title="Fast Exponential Moving Average, default 21", group = "Trends")
slowMovingAvg = input.int(defval=50, minval=8,title="Slow Exponential Moving Average, default 50", group = "Trends")

rsiLenght = input.int(defval=14, title="RSI Lenght, default 14", group = "Momentum")
overbought = input.int(defval=70, title="Overbought limit (RSI), default 70", group = "Momentum")
oversold = input.int(defval=30, title="Oversold limit (RSI), default 30", group = "Momentum")

hide = input.bool(defval=true, title="Hide all plots and legends from the chart (default: true)")


// Trade related
tradeType = input.string(defval='Both', group="Trade settings", title="Trade Type", options=['Both', 'TrendFollowing', 'Reversal'], tooltip="Consider all types of trades? Or only Trend Following or only Reversal? (default: Both).")
endOfDay = input.int(defval=1500, title="Close all trades, default is 3:00 PM, 1500 hours (integer)", group="Trade settings")
mktAlwaysOn = input.bool(defval=false, title="Markets that never closed (Crypto, Forex, Commodity)", tooltip="Some markers never closes. For those cases, make this checked. (Default: off)", group="Trade settings")


// Utils
annotatePlots(txt, val, hide) => 
    if (not hide)
        var l1 = label.new(bar_index, val, txt, style=label.style_label_left, size = size.tiny, textcolor = color.white, tooltip = txt)
        label.set_xy(l1, bar_index, val)

/////////////////////////////// Indicators /////////////////////
vwap = ta.vwap(src)
plot(hide ? na : vwap, color=color.purple, title="VWAP", style = plot.style_line)
annotatePlots('VWAP', vwap, hide)

// Bollinger Band of present time frame
[BBbasis, BBupper, BBlower] = ta.bb(src, BBlength, BBmult)
p1 = plot(hide ? na : BBupper, color=color.blue,title="Bollinger Bands Upper Line")
p2 = plot(hide ? na : BBlower, color=color.blue,title="Bollinger Bands Lower Line")
p3 = plot(hide ? na : BBbasis, color=color.maroon,title="Bollinger Bands Width", style=plot.style_circles, linewidth = 1)
annotatePlots('BB-Upper', BBupper, hide)
annotatePlots('BB-Lower', BBlower, hide)
annotatePlots('BB-Base(20-SMA)', BBbasis, hide)

// RSI
rsi = ta.rsi(src, rsiLenght)

// Trend following
ema50 = ta.ema(src, slowMovingAvg)
ema21 = ta.ema(src, fastMovingAvg)
annotatePlots('21-EMA', ema21, hide)
annotatePlots('50-EMA', ema50, hide)


// Trend conditions
upTrend = ema21 > ema50 
downTrend = ema21 < ema50


// Condition to check Special Entry: HH_LL
// Long side:
hhLLong = barstate.isconfirmed and (low > low[1]) and (high > high[1]) and (close > high[1])
hhLLShort = barstate.isconfirmed and (low < low[1]) and (high < high[1]) and (close < low[1])

longCond =  barstate.isconfirmed and (high[1] < BBlower[1]) and (close > BBlower) and (close < BBupper) and hhLLong and ta.crossover(rsi, oversold) and downTrend
shortCond = barstate.isconfirmed and (low[1] > BBupper[1]) and (close < BBupper) and (close > BBlower) and hhLLShort and ta.crossunder(rsi, overbought) and upTrend

// Trade execute
h = hour(time('1'), syminfo.timezone)
m = minute(time('1'), syminfo.timezone)
hourVal = h * 100 + m
totalTrades = strategy.opentrades + strategy.closedtrades
if (mktAlwaysOn or (hourVal < endOfDay))
    // Entry
    var float sl = na
    var float target = na
    if (longCond)
        strategy.entry("enter long", strategy.long, 1, limit=na, stop=na, comment="Long[E]")
        sl := low[1]
        target := high >= BBbasis ? BBupper : BBbasis
        alert('Buy:' + syminfo.ticker + ' ,SL:' + str.tostring(math.floor(sl)) + ', Target:' + str.tostring(target), alert.freq_once_per_bar)
    if (shortCond)
        strategy.entry("enter short", strategy.short, 1, limit=na, stop=na, comment="Short[E]")
        sl := high[1]
        target := low <= BBbasis ? BBlower : BBbasis
        alert('Sell:' + syminfo.ticker + ' ,SL:' + str.tostring(math.floor(sl)) + ', Target:' + str.tostring(target), alert.freq_once_per_bar)

    // Exit: target or SL
    if ((close >= target) or (close <= sl))
        strategy.close("enter long", comment=close < sl ? "Long[SL]" : "Long[T]")
    if ((close <= target) or (close >= sl))
        strategy.close("enter short", comment=close > sl ? "Short[SL]" : "Short[T]")
else if (not mktAlwaysOn)
    // Close all open position at the end if Day
    strategy.close_all(comment = "EoD[Exit]", alert_message = "EoD Exit", immediately = true)