ダブル移動平均ゴールデンクロスデスクロス反転戦略

概要
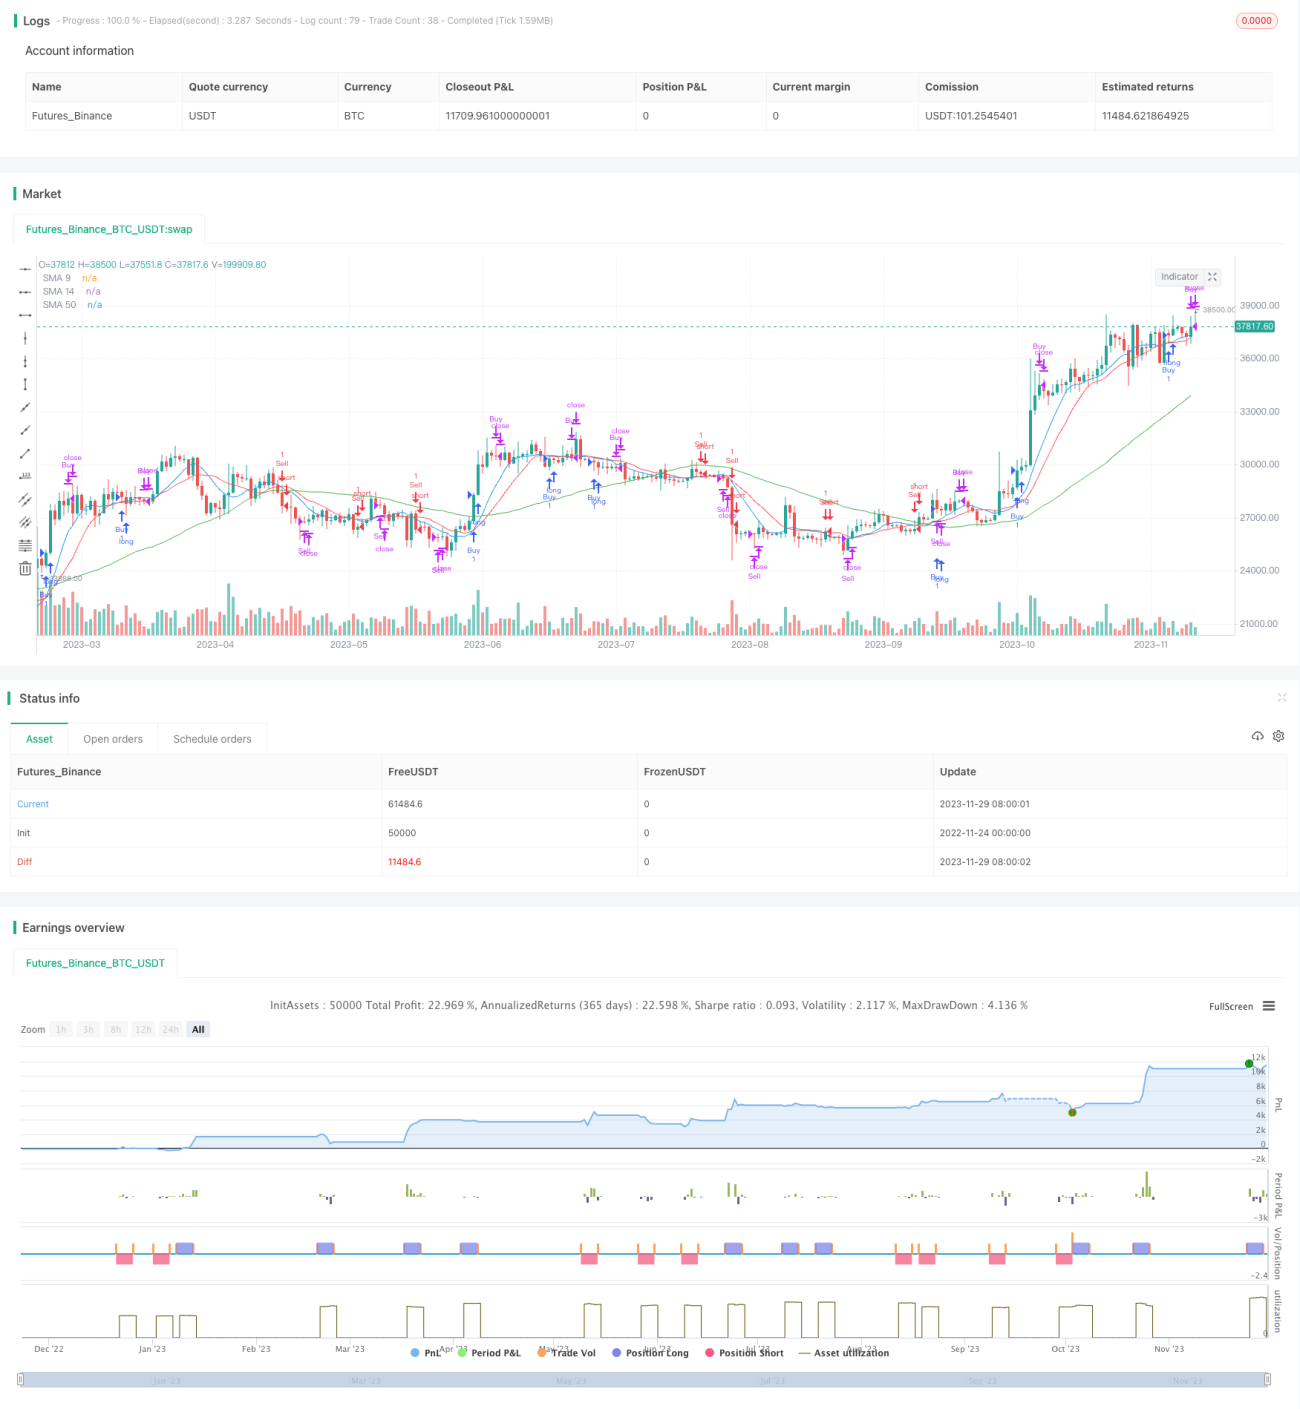
双移動均線金叉死叉反転戦略は,典型的なトレンドを追跡する量化取引戦略である.この戦略は,双移動均線指標の9日線と14日線を用い,買入と売却のシグナルを構築する. 9日線が下から14日線を突破して金叉を形成するときに買入し,9日線が上から14日線を突破して死叉を形成するときに売る.偽のシグナルをフィルターするために,戦略は50日線指標にも導入され,価格が突破するかどうかを判断する.
戦略原則
この戦略は主に2つの移動平均線指標の金叉と死叉の信号に基づいて取引する. 2つの移動平均線のうち,9日線は短期トレンドを代表し,14日線は中期トレンドを代表し,それらの交差は市場トレンドの転換を判断する有効な技術指標である. 短期トレンドラインが下部から中期トレンドラインを突破して金叉を形成すると,短期トレンドラインが強くなると,買入シグナルに属し,上部から突破して死叉を形成すると,短期トレンドラインが弱くなると,売出シグナルに属する.
さらに,戦略は50日線を導入し,誤導信号をフィルターする.50日線が50日線より高い時のみ,買いが生じ,50日線より低い時のみ,売りが生じます.50日線は中長期のトレンドを代表し,中長期のトレンドが同意する時のみ,短期操作を行います.
コードの中核の論理は次のとおりです.
pine
// 买入条件:9日线上穿14日线 且 当前价格高于50日线
buyCondition = ta.crossover(sma9, sma14) and close > sma50
// 卖出条件:9日线下穿14日线 且 当前价格低于50日线
sellCondition = ta.crossunder(sma9, sma14) and close < sma50
優位分析
移動均線戦略の利点は明らかです.
- 簡単な操作と理解しやすい実装,初心者のための学習
- 震災が起きたときの状況から逃れるため,
- 短期的な市場騒音に騙されないために,中長期の指標をフィルタリングする.
- ビジネスモデルやビジネスモデル, ビジネスモデル, ビジネスモデル, ビジネスモデル,
リスク分析
双動均線戦略にはリスクもあります.
- 極端な状況では,例えば,熊市が崩壊し,デッドフォークが形成されていなければ,すでに大幅な下落の状況が発生している.このとき,戦略は,デッドフォークが形成されるまで,大量に浮動損失のポジションを保持する.
- 振動的な状況では,金叉と死叉の交替が生じ,常にポジションを開くと停止する.このとき,より多くの取引コストが生じます.
リスクの最適化には,以下の方法があります.
- さらに他の指標のポートフォリオを導入し,崩壊の状況で迅速に止まる.
- 金融危機の金叉の交替を避けるために,開設条件のフィルターを増やす.
最適化の方向
双移動均線戦略は以下の点で最適化できます.
- 参数最適化。移動平均線の周期パラメータを調整し,指標パラメータを最適化。
- 倉庫開設のシグナルをさらにフィルタリングする.より多くの指標を組み合わせて状況を判断し,誤解を避ける.
- 止損メカニズムを導入する.移動止損,突破止損などの止損方法を設定する.
- 他の取引戦略と組み合わせる.取引量戦略,波動率戦略などの組み合わせで使用する.
- 適切なレバーの使用. 操作効率を向上させる.
要約する
双移動均線戦略は,全体的に見ると,効率的に利益をもたらす戦略である.それは順番に,継続的に利益をもたらすことができる;同時に,一定のリスクがあり,さらなる改善が必要である.パラメータ最適化,止損方法,および戦略の組み合わせによって,この戦略の効果をさらに強化することができる.
- 1