トレンド分析指標に基づく定量取引戦略

1
Follow
1779
Followers
概要
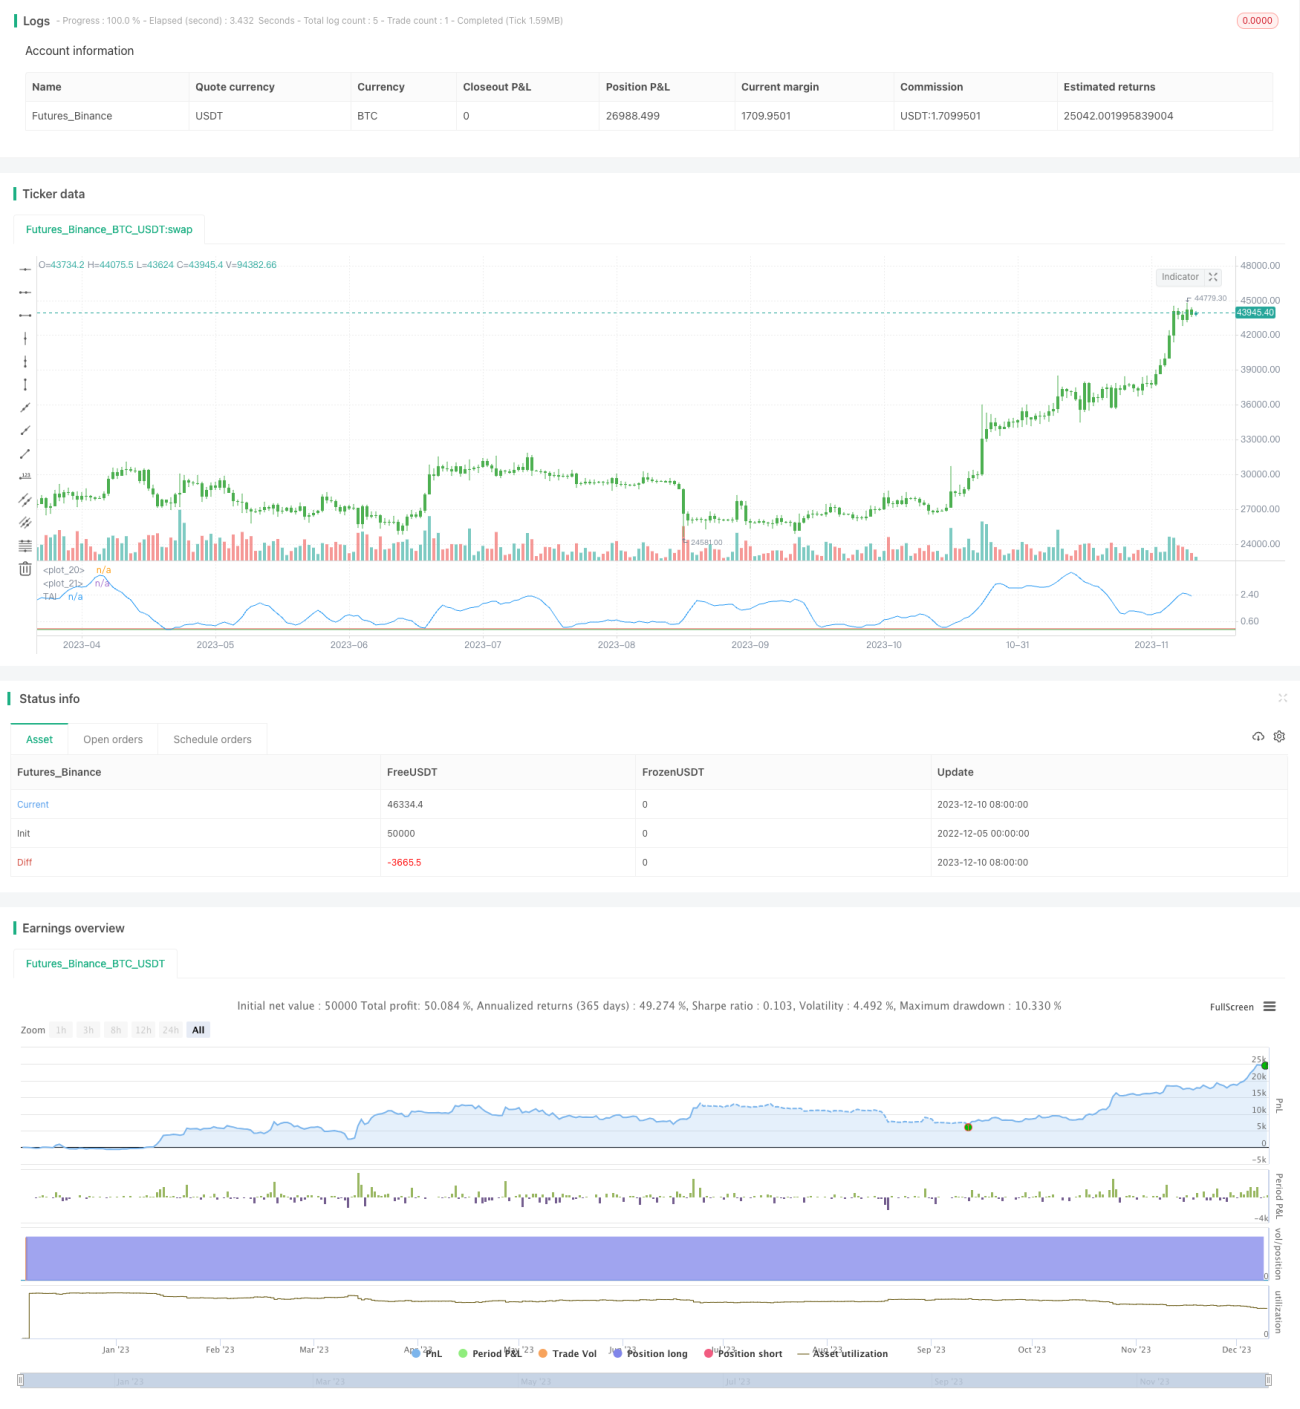
この戦略の核心思想は,移動平均の斜率を利用して市場のトレンドを判断し,トレンド分析指数 (Trend Analysis Index,TAI) を取引信号として構築することである.価格がトレンドの中で動作するときは,移動平均の斜率は大きくなり,価格が明確なトレンドのない区間内で振動するときは,移動平均の斜率は小さくなり,トレンド分析指数の増加はトレンドに入ることを示し,減少はトレンドの終了を示している.
戦略原則
この戦略は,まず,価格の単純な移動平均 ((X日移動平均) を計算する.それから,この移動平均の過去Y日の最高値と最低値を計算し,この2つの極端値を使って,過去Y日の移動平均の波動範囲を計算する.最後に,このY日の波動範囲と価格を比較して,0-1の間の標準化指標に変換する.つまり,トレンド分析指数を構築する.指数は,ある<unk>値より高いとき,プラス,ある<unk>値より低いとき,空になる.
優位分析
この戦略の利点は以下の通りです.
- 移動平均の斜率によってトレンドの走行を判断し,中長線トレンドを効果的に捉える
- 波動範囲の標準化とインデックス化指標の構築により,取引シグナルがより明確になります.
- 移動平均のパラメータとトレンド判断のパラメータをカスタマイズして,異なる市場環境に対応できます.
- 選択可能な反転取引,追跡または他の戦略をカバーする
リスク分析
この戦略にはリスクもあります.
- 震度調整では誤信号が発生しやすい
- 移動平均のパラメータが正しく設定されていなければ,トレンドの転換点を逃す可能性があります.
- 標準化パラメータの設定を間違えれば,弱気なトレンドが逃れられる
- 逆転取引では損失が増加する可能性がある
対応方法:
- 他の指標と組み合わせたフィルター信号
- パラメータを最適化して,最適なパラメータの組み合わせを見つける
- 標準化パラメータの値上がり調整
- 逆転取引を慎重に行う
最適化の方向
この戦略は以下の点で最適化できます.
- BOLLチャネルなどの他の指標と組み合わせることで,取引シグナルをより信頼できます.
- 単一損失を抑えるためのストップ・ストラトジーを追加
- 移動平均の日数パラメータを最適化して,異なる周期における市場の特徴に適合させる
- 最適な標準化パラメータを訓練し,最適なパラメータの<unk>値を見つけます.
- 機械学習モデルがトレンドの確率を予測し,取引を補助する
要約する
この戦略は,全体として,移動平均の斜率によってトレンドを判断する中長線戦略であり,トレンドを効果的に捉えることができるが,ある程度の偽信号の危険性もある.他の指標の組み合わせと使用し,ストップ・ロスを加え,パラメータ最適化などの手段によって,戦略をより安定して信頼できるようにすることができる.本質的には,比較的単純なトレンド追跡戦略である.
Source
Pine
//@version=2
////////////////////////////////////////////////////////////
//  Copyright by HPotter v1.0 21/12/2017
// In essence, it is simply the standard deviation of the last x bars of a
// y-bar moving average. Thus, the TAI is a simple trend indicator when prices
// trend with authority, the slope of the moving average increases, and when
// prices meander in a trendless range, the slope of the moving average decreases.
//
// You can change long to short in the Input Settings
// WARNING:
// - For purpose educate only
// - This script to change bars colors.Strategy parameters
Related strategies
Comment
All comments (0)
No data
- 1