ADX、RSI Momentum Indicators Strategy

Overview
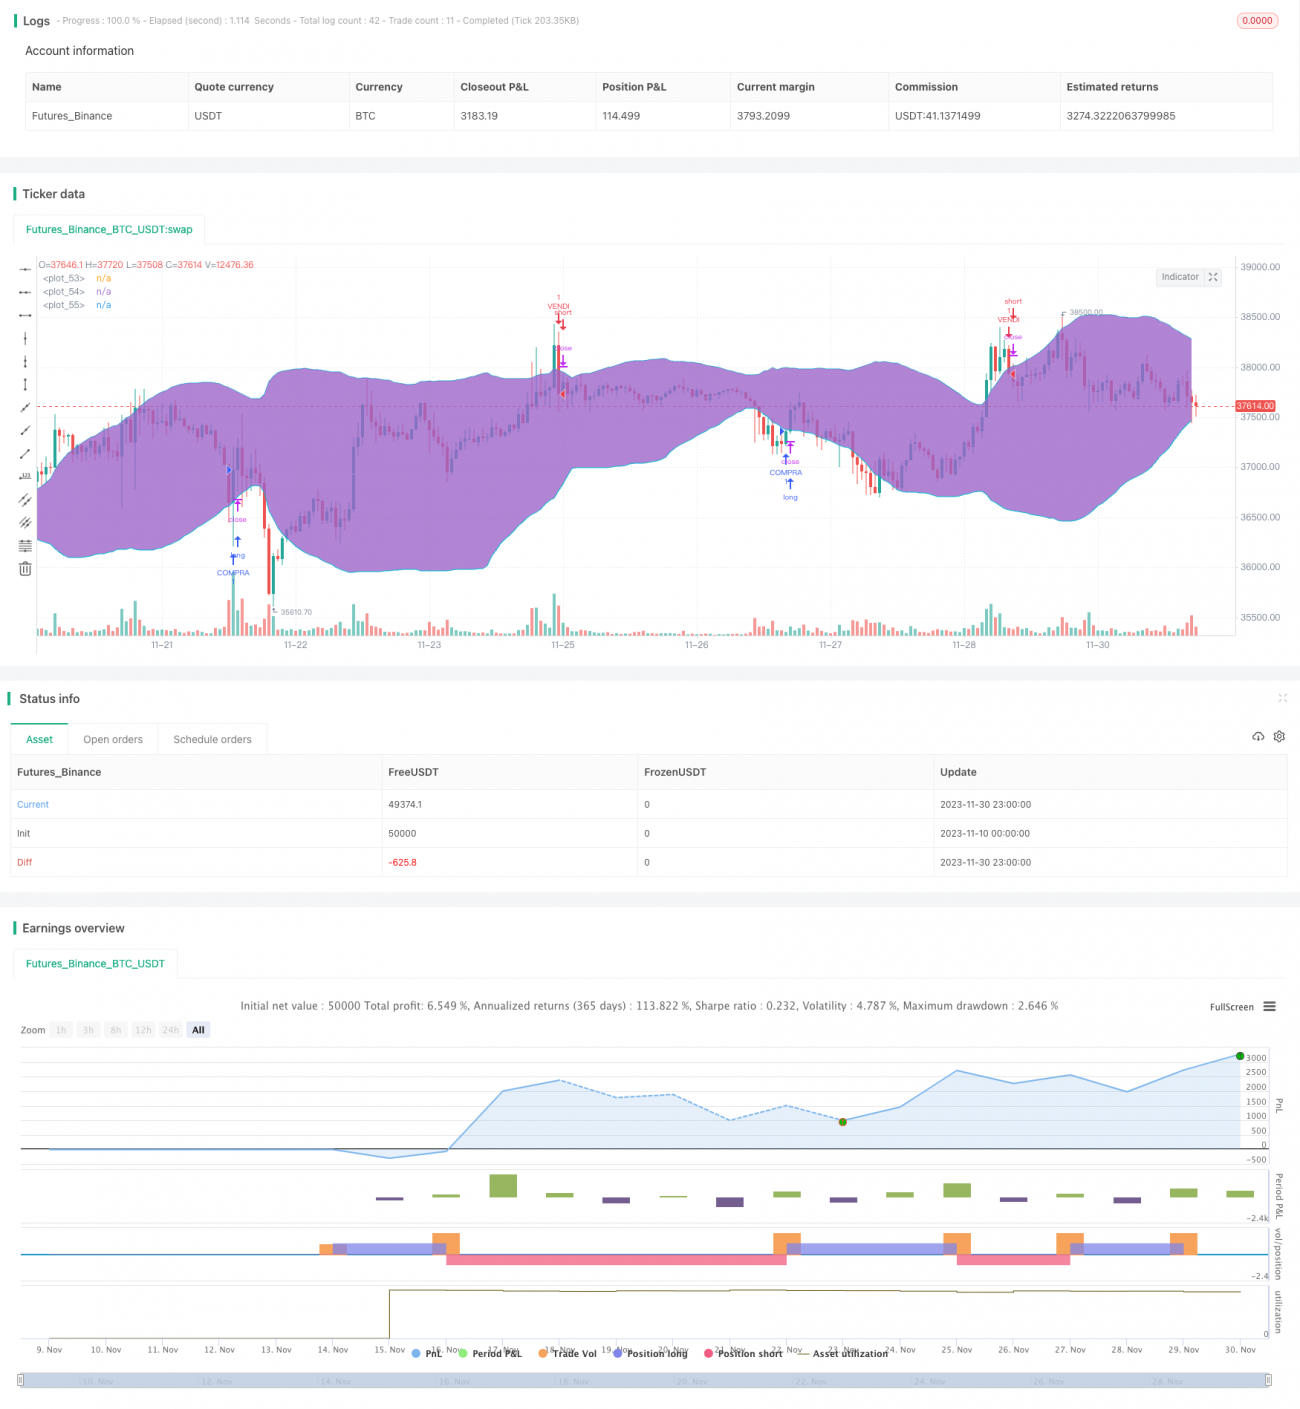
This strategy utilizes momentum indicators ADX, RSI and Bollinger Bands to determine market trends and overbought/oversold situations, in order to implement automated trading for buying low and selling high.
Strategy Principles
-
ADX indicator determines trend. When ADX is greater than 32, it indicates a trending market.
-
RSI indicator determines overbought/oversold levels. When RSI crosses above 30, it signals an oversold market. When RSI crosses below 70, it signals an overbought market.
-
Bollinger Bands determine consolidation and breakout. When close price breaks above the upper band, it signals the end of consolidation and upside breakout. When close price breaks below the lower band, it signals the end of consolidation and downside breakout.
Based on the indicators above, the trading strategy is defined as follows:
Buy condition:
- ADX>32, in trend
- RSI crosses above 30, oversold
- Close price below lower Bollinger band, end of downtrend consolidation
Sell condition:
- ADX>32, in trend
- RSI crosses below 70, overbought
- Close price above upper Bollinger band, end of uptrend consolidation
Advantage Analysis
This strategy utilizes multiple indicators to determine market conditions, avoiding the probability of error when relying on a single indicator. By determining trend and overbought/oversold status, it can effectively capture market turning points and achieve buy low sell high.
Compared to using trend indicators alone, this strategy can capture short-term opportunities in a timelier manner. Compared to using solely oscillators, this strategy can better grasp the trend direction. Therefore, it retains the advantage of tracking trends, while also having the flexibility of mean-reversion trading. It is a potentially efficient quantitative strategy.
Risk Analysis
The main risks of this strategy includes:
-
Risk of false signals from indicators. Indicators may fail when markets experience extreme events.
-
Risk of stops being too tight. Short-term market fluctuations may take out the position if stops are too close.
-
Risk of overfitting. If indicator parameters are merely fitted to historical data, the stability would be questionable and may fail to adapt to changing market dynamics.
Risk management measures:
-
Manually intervene under abnormal market conditions to pause the strategy and avoid losses from false signals.
-
Set reasonable stop distance, combining with moving averages to determine stop levels, avoiding being stopped out prematurely.
-
Introduce Parameter Tuning module, dynamically optimize parameters using Walk Forward Analysis to ensure robustness.
Optimization Directions
The main aspects to improve this strategy includes:
-
Optimize indicator parameters, using machine learning algorithms tailored to each market.
-
Feature engineering, introducing more technical indicators and training models like SVM to improve signal accuracy.
-
Incorporate breakout strategies based on characteristics of each market using price channels, supports/resistances etc. to enhance stability.
-
Optimize profit taking and stop loss mechanisms by introducing trailing stops, moving stops etc. to maximize profit and effectively control risks.
Conclusion
This medium-term quantitative trading strategy utilizes multiple technical indicators like ADX, RSI and Bollinger Bands to determine market conditions and places trades when significant structural changes are identified. The logic is clear and interpretable, drastically reducing reliance on a single indicator. Meanwhile, risks like false signals, overly tight stops and parameter overfitting needs to be addressed through risk management and model optimization to enhance stability and efficiency.
- 1