Dual Moving Average Bollinger Band Trend Tracking Strategy

Author: ChaoZhang, Date: 2023-12-11 15:10:02
Tags:

img

Overview

This strategy determines the general market trend direction by calculating two exponential moving averages (EMA) over different timeframes, and identifies overbought and oversold opportunities along the trend direction using adaptive Bollinger Bands to implement trend trading.

Strategy Logic

  1. The 200-period EMA and 30-period EMA are calculated. If the 200 EMA is greater than the 30 EMA, the long-term trend is determined as up. Otherwise, it is determined as down.

  2. After the trend direction is determined, the baseline, upper band and lower band of the Bollinger Bands are calculated. The baseline adopts SMA over a configurable timeframe (e.g. 8 periods). The band width is a configurable multiplier (e.g. 1.3 and 1.1) of the amplitude of the highest and lowest prices over the same period as the baseline.

  3. When the long-term trend is up, the lower band breakout signals long entry; when the long-term trend is down, the upper band breakdown signals short entry.

  4. To filter false breakouts, the rate of change over the last candle before the breakout is checked to be below a configurable threshold (e.g. 3%), and the band width is checked to be greater than a configurable level (e.g. 2.2% of close price).

  5. After opening positions, configurable stop loss (e.g. -3%) and take profit (e.g. 10%) are set to lock in profits.

Strategy Strengths

  1. The dual EMAs define the major trend and avoid disorderly opening positions when the major trend is unclear.

  2. The adaptive Bollinger Bands set entry points along the trend. The auto width adjustment locks the trend further.

  3. The rate of change and the minimum width requirements effectively filter false breakouts.

  4. The stop loss and take profit settings reasonably lock profits while keeping risks under control.

Strategy Risks

  1. The dual EMAs fails to accurately locate trend reversal points, missing opportunity at trend turning points.

  2. Improper BB parameter settings may cause false signals.

  3. Fixed stop loss and take profit cannot adapt to market fluctuations.

Optimization Directions

  1. Incorporate other indicators to determine major and secondary trend reversals.

  2. Adopt dynamic adjustment of BB parameters.

  3. Set conditional orders for stop loss and take profit based on specific criteria.

Conclusion

This strategy implements trend trading by judging the major trend using dual EMAs and identifying opportunities with Bollinger Bands. Its strength lies in reasonably setting entry, stop loss and take profit conditions to lock in trend profits. There are also some risks, like failing to catch trend turning points and improper BB parameter settings. Further optimizations in these aspects will empower the strategy to seize trend profits better.
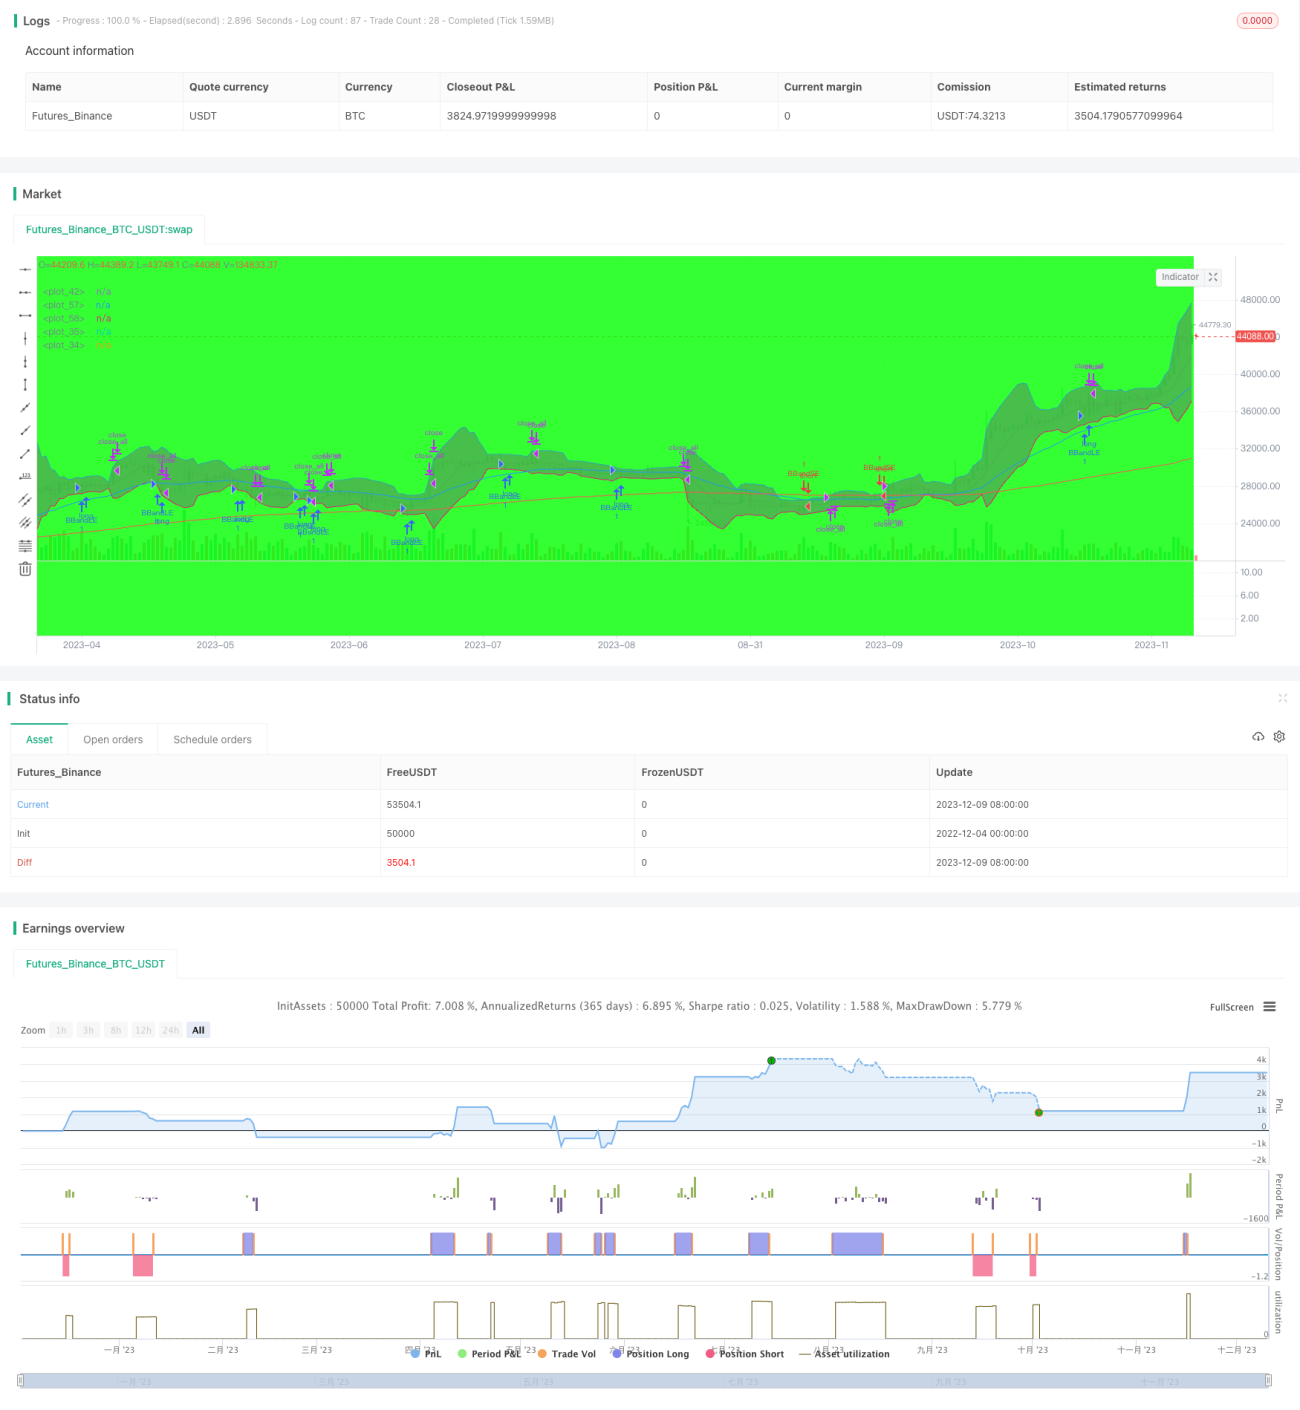

/*backtest
start: 2022-12-04 00:00:00
end: 2023-12-10 00:00:00
period: 1d
basePeriod: 1h
exchanges: [{"eid":"Futures_Binance","currency":"BTC_USDT"}]
*/

//@version=3
//////////////////////////////////////////////////////////////////////
// Component Code Start
testStartYear = input(2019, "Backtest Start Year")
testStartMonth = input(1, "Backtest Start Month")
testStartDay = input(1, "Backtest Start Day")
testPeriodStart = timestamp(testStartYear,testStartMonth,testStartDay,0,0)

testStopYear = input(2039, "Backtest Stop Year")
testStopMonth = input(12, "Backtest Stop Month")
testStopDay = input(31, "Backtest Stop Day")
testPeriodStop = timestamp(testStopYear,testStopMonth,testStopDay,0,0)

// A switch to control background coloring of the test period
testPeriodBackground = input(title="Color Background?", type=bool, defval=true)
testPeriodBackgroundColor = testPeriodBackground and (time >= testPeriodStart) and (time <= testPeriodStop) ? #00FF00 : na
bgcolor(testPeriodBackgroundColor, transp=97)

testPeriod() =>
    time >= testPeriodStart and time <= testPeriodStop ? true : false
// Component Code Stop

strategy("Custom Band Strategy", overlay=true)
source = close //종가 기준

//추세 조건 설정
emaLong = ema(source, input(200, minval=0))
emaShort = ema(source, input(30, minval=0))
trend = if emaShort>=emaLong
    1
else
    -1
    
plot(emaLong, color=red, transp=0)
plot(emaShort, color=blue, transp=0)


//BB 계산(default 14/3.2)
length = input(8, minval=1)

basis = sma(source, length)
plot(basis, color=green, transp=0)
max=highest(abs(source-basis), length)

factor1 = input(1.3, minval=0.5)
factor2 = input(1.1, minval=0.5)

upper = if trend==1
    basis + max*factor1
else
    basis + max*factor2
lower = if trend==-1
    basis - max*factor1
else
    basis - max*factor2

plot1 = plot(upper)
plot2 = plot(lower)
fill(plot1, plot2, transp=80, color=green)

//밴드 이탈 후 재진입 조건 설정
cross_over = (low<=lower and close>=lower) or crossover(close,lower)
cross_under = (high>=upper and close<=upper) or crossunder(close,upper)

//변동율 계산
maxCandle=highest(abs(open-close), length)
    
roc = abs(open-close)/open*100
changerate = input(3, minval=0.0)

//수익률 계산
value = abs(strategy.position_size)*strategy.position_avg_price
roe = strategy.openprofit/value * 100
expRoeL = (upper-lower)/lower*100
expRoeS = (upper-lower)/upper*100
exp = input(2.2, minval=0.0)

target = input(10, minval=0.0)
stop = input(-3, minval=-10.0)

strategy.close_all(when=roc>=changerate and testPeriod())
strategy.close_all(when=roe>=target and testPeriod())
strategy.close_all(when=roe<=stop and testPeriod())

plotchar(crossover(close,lower) and crossunder(close,upper),color=blue, transp=0, text="cross")
plotchar(roc>=changerate,color=red, transp=0, text="roc")
plotchar(roe>=target,color=blue, transp=0, text="target")
plotchar(roe<=stop,color=green, transp=0, text="stop")

minroe = input(2, minval=0.0)

strategy.close_all(when=cross_under and roe>minroe and testPeriod())
strategy.entry("BBandLE", strategy.long, stop=source, oca_name="BollingerBands",  comment="BBandLE", when=(cross_over) and trend==1 and roc<changerate and expRoeL>exp and source>emaLong and strategy.position_size==0 and testPeriod()) //trend==1 and 
//else
strategy.close_all(when=cross_over and roe>minroe and testPeriod())
strategy.entry("BBandSE", strategy.short, stop=source, oca_name="BollingerBands",  comment="BBandSE", when=(cross_under) and trend==-1 and roc<changerate and expRoeS>exp and source<emaLong and strategy.position_size==0 and testPeriod()) //trend==-1 and 

More