52 Week High Low Box Trading Strategy

Author: ChaoZhang, Date: 2023-12-11 14:43:30
Tags:

img

Overview

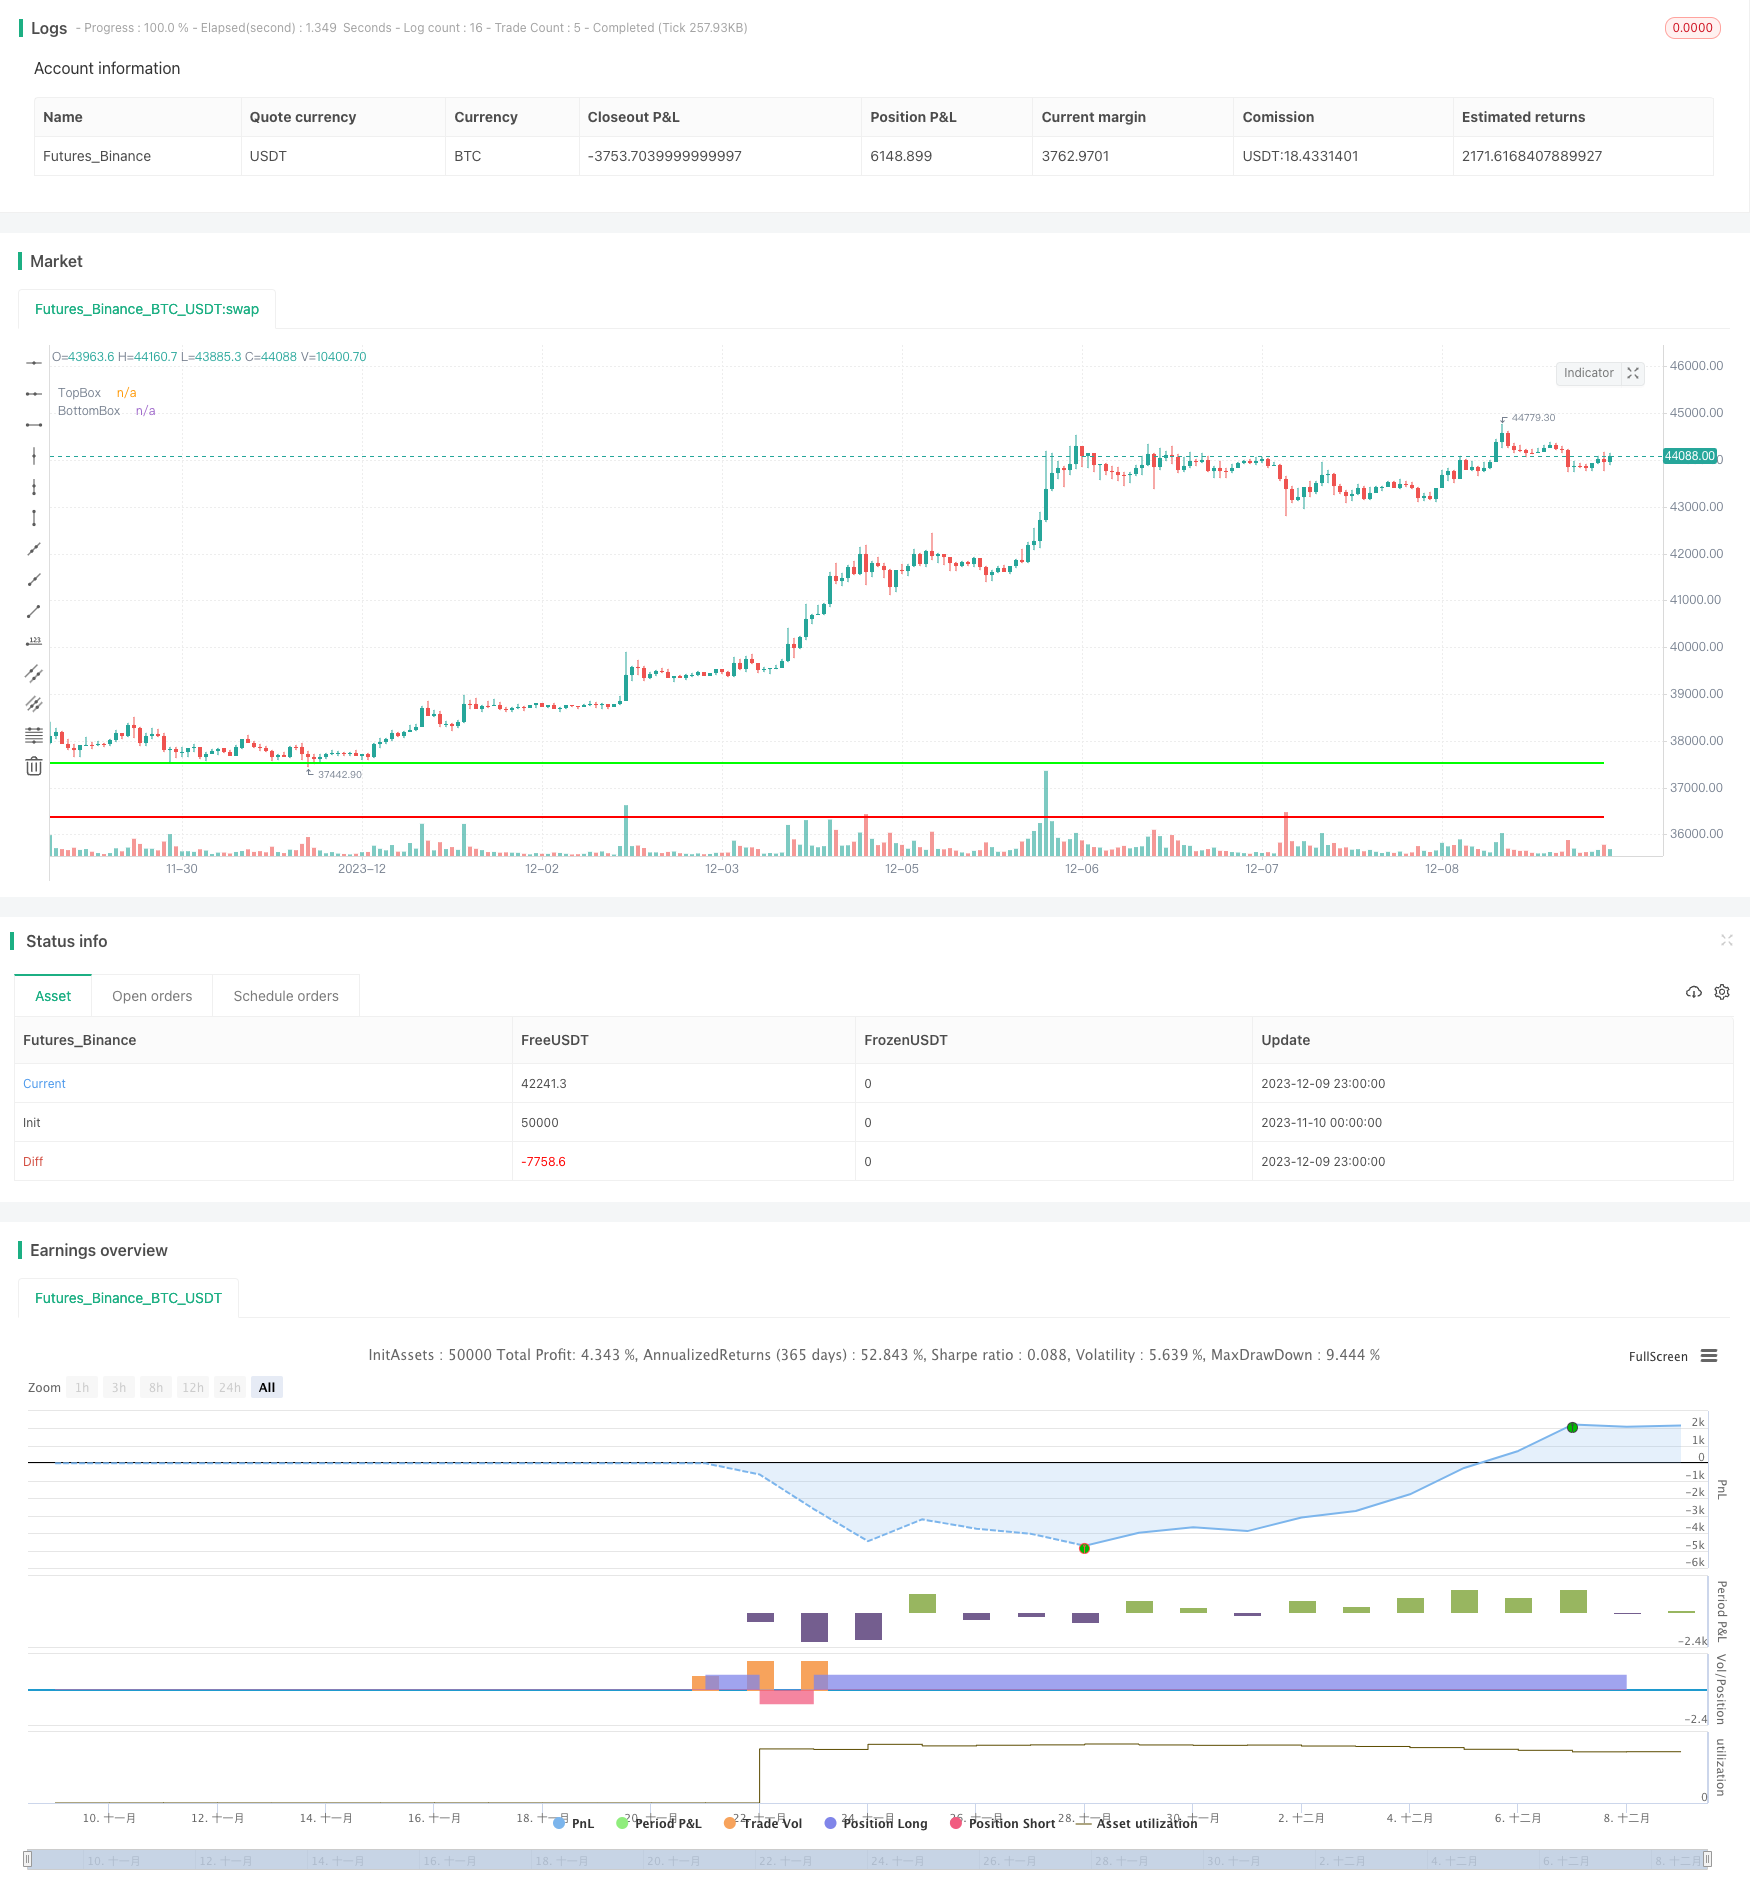
The 52 Week High Low Box Trading Strategy is a strategy that uses the “boxes” formed by price oscillating in different ranges as trading signals. The core logic of this strategy is that when the price breaks through the upper or lower limit of a certain range (box), it indicates that the price is entering a new range, at which point a long or short position can be opened.

Strategy Principle

This strategy calculates the highest high and lowest low over the past 5 days (adjustable) to determine if the price has entered a new trading range. The specific rules are:

  1. Calculate the highest high and lowest low over the most recent 5 days to form a trading range box.

  2. When the price breaks above the upper limit of this range, it indicates that it may be entering a higher range and a long position can be opened.

  3. When the price drops below the lower limit of this range, it indicates that it may be entering a lower range and a short position can be opened.

  4. Set the stop loss near the upper/lower limit of the previous range to control risk.

  5. Repeat the above judgments and continuously adjust the trading range to realize profits.

Using such breakthroughs to determine trends and generate trading signals is the core idea of ​​this strategy.

Advantage Analysis

The 52 Week High Low Box Trading Strategy has the following advantages:

  1. The strategy logic is simple and intuitive, easy to understand and implement.

  2. It can capture trending moves after prices enter new ranges. Range breakouts are relatively reliable trading signals.

  3. There is a clear stop loss strategy that can effectively control risk.

  4. The range length can be adjusted to adapt to different cycle ranges and different varieties.

In general, this is a trend trading strategy with good risk control capabilities and practicality.

Risk Analysis

The strategy also has some risks, mainly including:

  1. When the trend is not obvious, multiple small losses may occur.

  2. Improper range settings also increase the probability of erroneous trades.

  3. The stop loss strategy cannot completely avoid the risk of huge price gaps.

This requires traders to continuously test and optimize the parameters of the strategy in practice and carefully manage risks.

Optimization Directions

The 52 Week High Low Box Trading Strategy can also be optimized in the following aspects:

  1. Combine trading volume or moving average indicators to verify buy and sell signals and improve accuracy.

  2. Optimize the length parameters of the box to adapt to market changes.

  3. After breakthrough purchases, waiting for pullbacks to form more chances for re-entry.

  4. Use the compounding principle to appropriately increase positions on each stop loss to pursue higher returns.

Through parameter adjustment and rule optimization in the implementation process, the effect of this strategy can be continuously improved.

Summary

The 52 Week High Low Box Trading Strategy is a strategy that determines trend direction based on price breakouts. It has simple trading logic and strong risk control capabilities. Continuous testing and optimization is needed in practice to fully exploit the advantages of this strategy. Overall, this is a recommended practical trading strategy.


/*backtest
start: 2023-11-10 00:00:00
end: 2023-12-10 00:00:00
period: 1h
basePeriod: 15m
exchanges: [{"eid":"Futures_Binance","currency":"BTC_USDT"}]
*/

// This source code is subject to the terms of the Mozilla Public License 2.0 at https://mozilla.org/MPL/2.0/
// © ceyhun

//@version=4
strategy ("Darvas Box Strategy",overlay=true)

boxp=input(5, "BOX LENGTH")

D_High = security(syminfo.tickerid, 'D', high) 
D_Low = security(syminfo.tickerid, 'D', low) 
D_Close =  security(syminfo.tickerid, 'D', close) 
D_Open =  security(syminfo.tickerid, 'D', open) 

LL = lowest(D_Low,boxp)
k1 = highest(D_High,boxp)
k2 = highest(D_High,boxp-1)
k3 = highest(D_High,boxp-2)

NH   = valuewhen(D_High>k1[1],D_High,0)
box1 = k3<k2
TopBox = valuewhen(barssince(D_High>k1[1])==boxp-2 and box1, NH, 0)
BottomBox = valuewhen(barssince(D_High>k1[1])==boxp-2 and box1, LL, 0)

plot(TopBox, linewidth=2, color=#00FF00, title="TopBox")
plot(BottomBox, linewidth=2, color=#FF0000, title="BottomBox")

if crossover(D_Close,TopBox)
    strategy.entry("Long", strategy.long, comment="Long")

if crossunder(D_Close,BottomBox)
    strategy.entry("Short", strategy.short, comment="Short")


More