概述
EMA与SuperTrend组合趋势跟踪策略通过巧妙地结合EMA指标和SuperTrend指标来识别市场趋势并给出清晰的入场和出场信号。该策略自定义了SuperTrend参数以及EMA参数以适应不同交易风格。颜色编码的K线条使得识别趋势变得直观。策略基于EMA和SuperTrend指标之间的交叉信号判断入场时机。出场规则灵活,既可以在趋势反转时退出,也可以在价格重新跨越EMA时退出,有助于风险管理。
策略原理
该策略使用SuperTrend指标判断主要趋势方向。SuperTrend指标本质上是将ATR指标与移动平均线结合,利用价格突破平均线来判断趋势转折点。另一方面,EMA指标的作用是辅助判断短期趋势方向。只有当价格处于EMA之上时才会考虑做多,只有当价格处于EMA之下时才会考虑做空。
具体来说,策略采用如下判断规则:
1. 做多信号:当价格向上突破SuperTrend线且高于EMA时;
2. 做空信号:当价格向下突破SuperTrend线且低于EMA时;
3. 平多头仓:当价格向下突破SuperTrend线或低于EMA时;
4. 平空头仓:当价格向上突破SuperTrend线或高于EMA时。
优势分析
稳定的趋势识别
EMA与SuperTrend的组合使得对趋势判断更加可靠。相比单一指标,该组合更能有效地过滤掉部分假突破。
灵活的参数调整
允许自定义SuperTrend和EMA的参数,从而适应不同品种和不同时间周期。
清晰的入场和出场信号
策略给出的做多做空信号比较清楚,有助于决策。出场规则也比较明确,便于风险控制。
直观的界面表达
根据价格与EMA的位置关系,K线条呈现不同颜色,形成直观的视觉效果。
风险分析
可能漏掉部分机会
相比单一指标,该策略对信号的确认要求较高,因此可能会漏掉回调不深的机会。
假突破风险仍存在
尽管该策略对突破信号进行了验证,但在市场剧烈波动时,仍有发生假突破从而使策略失败的可能。
效果与参数设置相关
SuperTrend和EMA的参数设置会对策略效果产生很大影响。如果参数设置不当,会出现多次离场又开仓的情况。
优化方向
结合其他指标过滤信号
可考虑加入如MACD,Stochastics等其他指标与EMA和SuperTrend形成组合,从而进一步验证信号,减少假突破概率。
多时间周期验证
在更高的时间周期(如日线)判断趋势方向,以此来验证和筛选当前周期产生的信号。
自动参数优化
可以尝试通过遍历不同的参数组合,并根据回测指标来自动选择对给定品种和时间周期最优的参数设置。
总结
EMA与SuperTrend组合趋势跟踪策略成功地结合了趋势判断和趋势跟踪的优点。该策略稳定、清晰的信号以及可自定义的参数为交易决策提供了有力支持。当然,我们仍需警惕可能的假突破风险。通过添加其他指标或者多时间周期分析等方式进行验证可以使策略效果得到进一步提升。
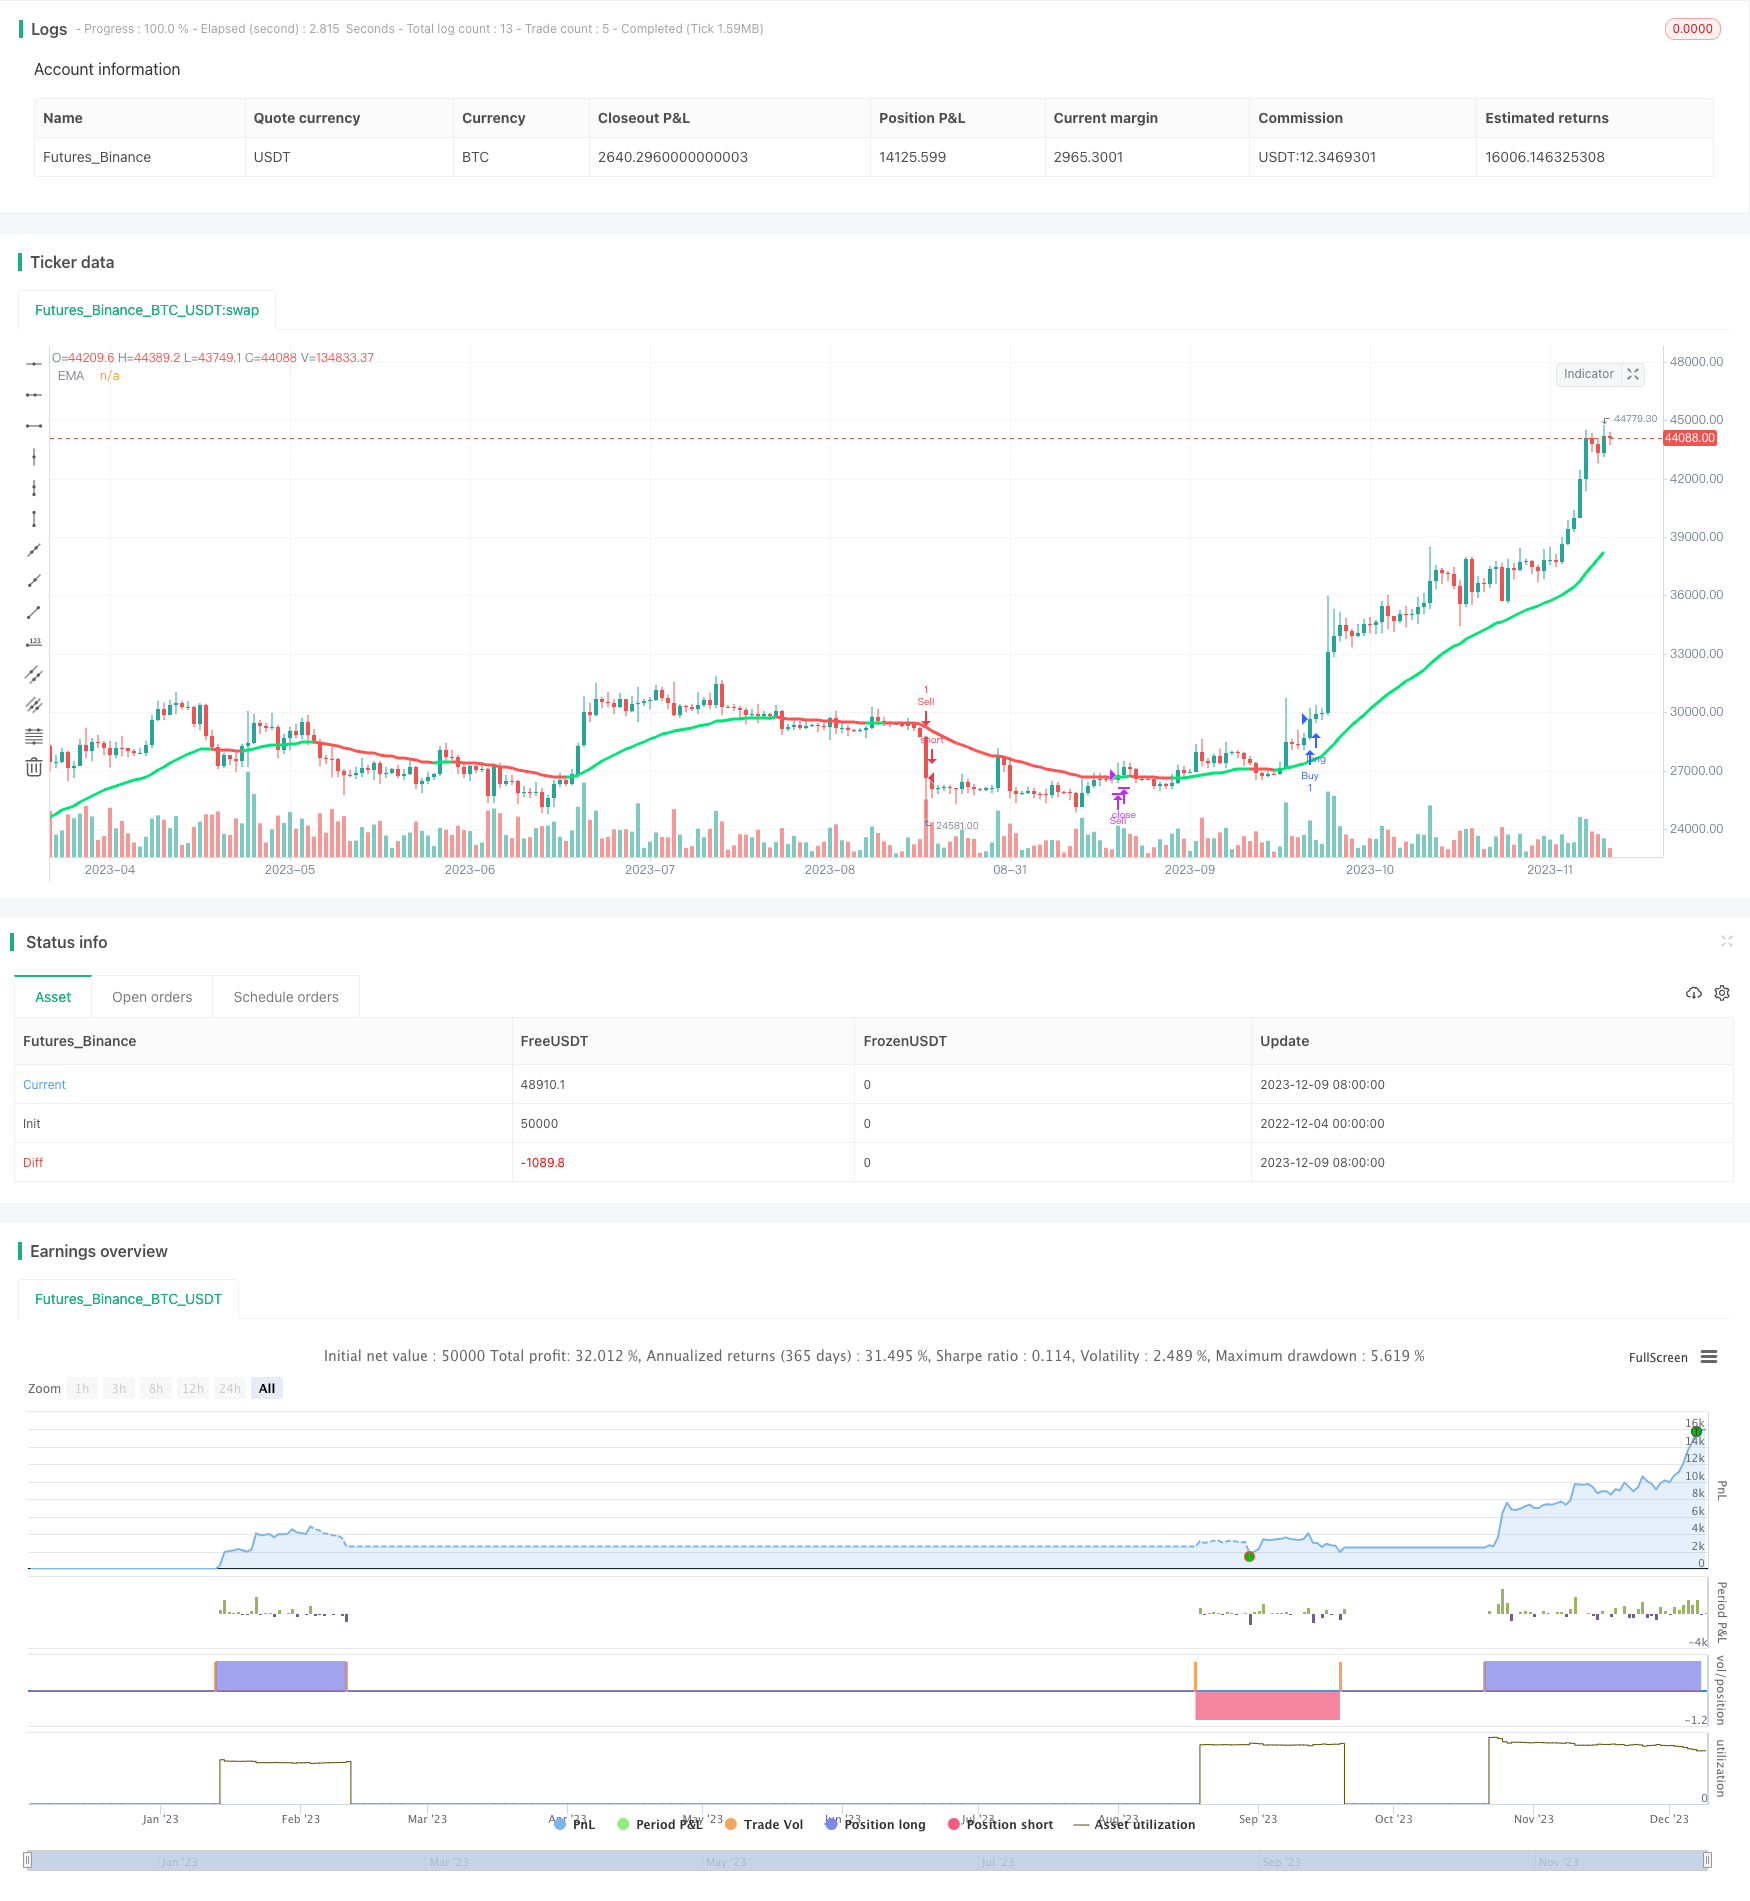
/*backtest
start: 2022-12-04 00:00:00
end: 2023-12-10 00:00:00
period: 1d
basePeriod: 1h
exchanges: [{"eid":"Futures_Binance","currency":"BTC_USDT"}]
*/

//@version=5
strategy("EMA SuperTrend Strategy", overlay=true)

// SuperTrend EMA Settings
length = input.int(10, title="SuperTrend Length")
mult = input.float(2.0, title="Multiplier")
emaLength = input.int(34, title="EMA UpTrend", minval=1, maxval=300)

// EMA calculation for EMA Trend Bars
ema1 = input.int(34, title="EMA UpTrend", minval=1, maxval=300)
shema = input(true, title="Show EMA Trend is Based On?")

usedEma = ta.ema(close, ema1)

// EMA Trend Bars color
emaUpColor() => hlc3 >= usedEma
emaDownColor() => hlc3 < usedEma
col = hlc3 >= usedEma ? color.lime : hlc3 < usedEma ? color.red : color.white

// SuperTrend calculation
atrPeriod = int(mult)
[supertrend, direction] = ta.supertrend(length, atrPeriod)

// Entry conditions
longEntry = ta.crossover(close, supertrend) and close > usedEma
shortEntry = ta.crossunder(close, supertrend) and close < usedEma

// Exit conditions
longExit = ta.crossunder(close, supertrend) or close < usedEma
shortExit = ta.crossover(close, supertrend) or close > usedEma

// Execute trades
if (longEntry)
    strategy.entry("Buy", strategy.long)

if (longExit)
    strategy.close("Buy")

if (shortEntry)
    strategy.entry("Sell", strategy.short)

if (shortExit)
    strategy.close("Sell")

// Plotting
plot(shema and usedEma ? usedEma : na, title="EMA", style=plot.style_line, linewidth=3, color=col)