RSIとボリンジャーバンドのデュアル戦略

1
Follow
1779
Followers
概要
この戦略の核心思想は,比較的強い指標 ((RSI) とブルリン带の2つの技術指標を組み合わせて,二重取引信号のフィルタリングを実現し,偽の信号の干渉を最大限に減らし,信号の質を向上させることである.
RSIは,価格がブレーキを突破したり,ブリン帯を下回りさせたりすると,取引の機会が生まれます. それは,市場の変動の統計的特性を考慮し,市場参加者の多空状態にも注目し,総合的な判断の基礎を形成します.
戦略原則
RSIの部分では,2つの異なる周期のRSI指標を同時に観察します. 短い周期は,超買い超売り信号を捕捉するために使用され,長い周期は,トレンドの逆転を確認するために使用されます.
ブリン帯部分では,価格が上下軌道に突破するかどうかについて注目します. ブリン帯を突破すると上下軌道がセールポイントで,下下軌道が買いポイントになります. また,価格がブリン帯を回調するかどうかについても注目します.
RSI信号とブリン帯の信号が同時に表示されると,取引の機会が形成され,取引指示が発せられる.
優位分析
- 二重指数フィルター,高い信頼性,余剰取引を避ける
- トレンドと逆転を考慮し,異なる市場段階の機会を把握する
- パラメータは,必要に応じてパラメータを調整することができます
- 時間と資金の管理
リスク分析
- ブリン帯のパラメータが正しく設定されていない場合,偽信号が発生する可能性があります.
- 市場が急激に波動する極端な状況に対応できない
- RSIが散らばると誤った信号が出る
- 異なる品種と周期に対応するためにパラメータを最適化する必要があります
パラメータ最適化,適当なポジションの縮小,人工介入などの方法でリスクを回避し,制御することができる.
最適化の方向
- RSIのパラメータを調整し,超買超売判断を最適化する
- ブリン帯域幅の調整,ブリン帯域突破戦略の最適化
- ポジション管理機構の追加
- ストップ・ロスの策略を増やす
- 複数の指標を組み合わせた多要素モデル
要約する
RSIとブリン帯の二重戦略は,2つの指標の優位性を最大限に活用し,高品質の信号を生成し,パラメータの最適化とリスク管理が置かれた前提で,安定した投資収益を得ることができます.より多くの信号とモデルを組み合わせることは,将来の可能性のある方向です.
Source
Pine
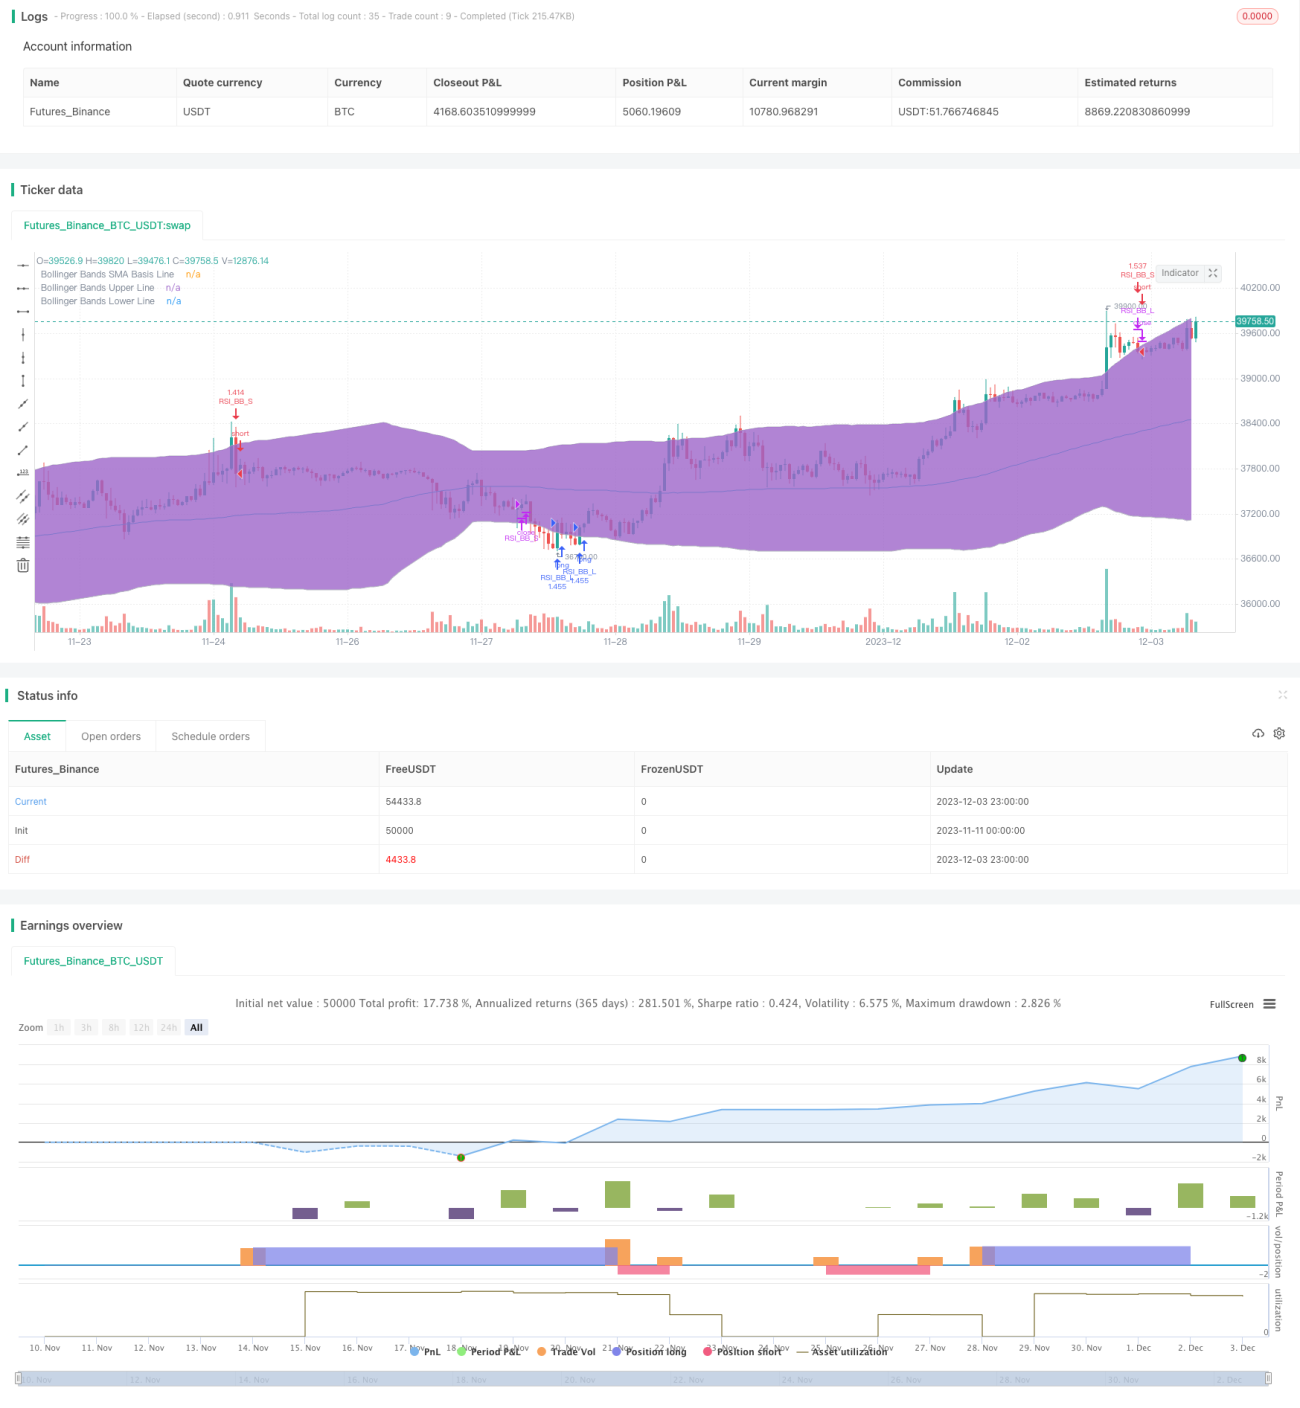
/*backtest
start: 2023-11-11 00:00:00
end: 2023-12-04 00:00:00
period: 1h
basePeriod: 15m
exchanges: [{"eid":"Futures_Binance","currency":"BTC_USDT"}]
*/

//@version=4
strategy("Ezieh Str.v2", shorttitle="Ezieh Str.v2", overlay=true, pyramiding=10, currency=currency.USD, slippage=3, commission_type=strategy.commission.cash_per_order, commission_value=0.04, initial_capital=1000)
Strategy parameters
Related strategies
Comment
All comments (0)
No data
- 1