Momentum Filtering Moving Average Strategy

Overview
This is a moving average trading strategy built with momentum filtering techniques. It sets a threshold for price changes to filter out small price fluctuations, only selecting large price movements for calculation, thereby improving the stability of the strategy.
Strategy Logic
The core indicator of this strategy is the Chande Momentum Oscillator (CMO) filtered by momentum. The Chande Momentum Oscillator is a kind of momentum indicator that judges the momentum of trends by calculating the ratio of the sum of the absolute values of up days and down days to the sum of price rises and falls. This strategy improves it by setting a minimum threshold of price changes called Filter. Only when the price change exceeds this threshold will it participate in the CMO calculation. This filters out a lot of small fluctuations in the market and makes the indicator more stable and reliable.
Based on the indicator calculation, it sets upper line TopBand and lower line LowBand. When the indicator exceeds these two lines, trading signals are generated. Finally, the reverse input parameter can reverse the original signals to realize reverse operation.
Advantage Analysis
This is a very stable and reliable trend-following strategy. By adopting momentum filtering techniques, it can effectively filter out market noise and prevent being trapped. The strategy has large parameter optimization space, parameters like Filter, TopBand, LowBand, etc. can be adjusted to optimize the strategy indicator. It also has reverse trading functionality that can flexibly adapt to different market environments.
Risk Analysis
The strategy mainly relies on trend-following, so it is prone to generating false signals and losses in range-bound markets. In addition, improper parameter optimization can also lead to excessive trading frequency or unstable signals. Finally, improper use of the reverse trading parameter may lead to unnecessary losses.
To reduce these risks, parameters should be reasonably optimized to make the signals more stable and reliable; avoid using this strategy in range-bound markets, choose more suitable strategy tools; use reverse trading functions with caution, avoid enabling it when parameter optimization is not ideal.
Optimization Directions
The strategy can be optimized in the following aspects:
-
Optimize the Filter parameter value, ensure filtering market noise while keeping trading frequency not too low.
-
Optimize the parameter range of TopBand and LowBand to match the market volatility range to prevent false signals.
-
Use walk forward analysis and other methods to dynamically optimize parameters so that strategy parameters adapt to market changes.
-
Add stop loss logic and set reasonable stop loss points to control losses.
-
Filter with other technical indicators like MACD, KD to avoid false trades in non-trending markets.
Summary
This is a very practical trend-following strategy. It adopts momentum filtering techniques to effectively curb market noise and make clearer and more reliable signals. Through parameter optimization and logic optimization, it can be tuned into a reliable and stable quantitative trading tool. Still, risks from using it in range-bound markets and improper parameter optimization need to be noted. In general, this is a strategy template with great application prospects.
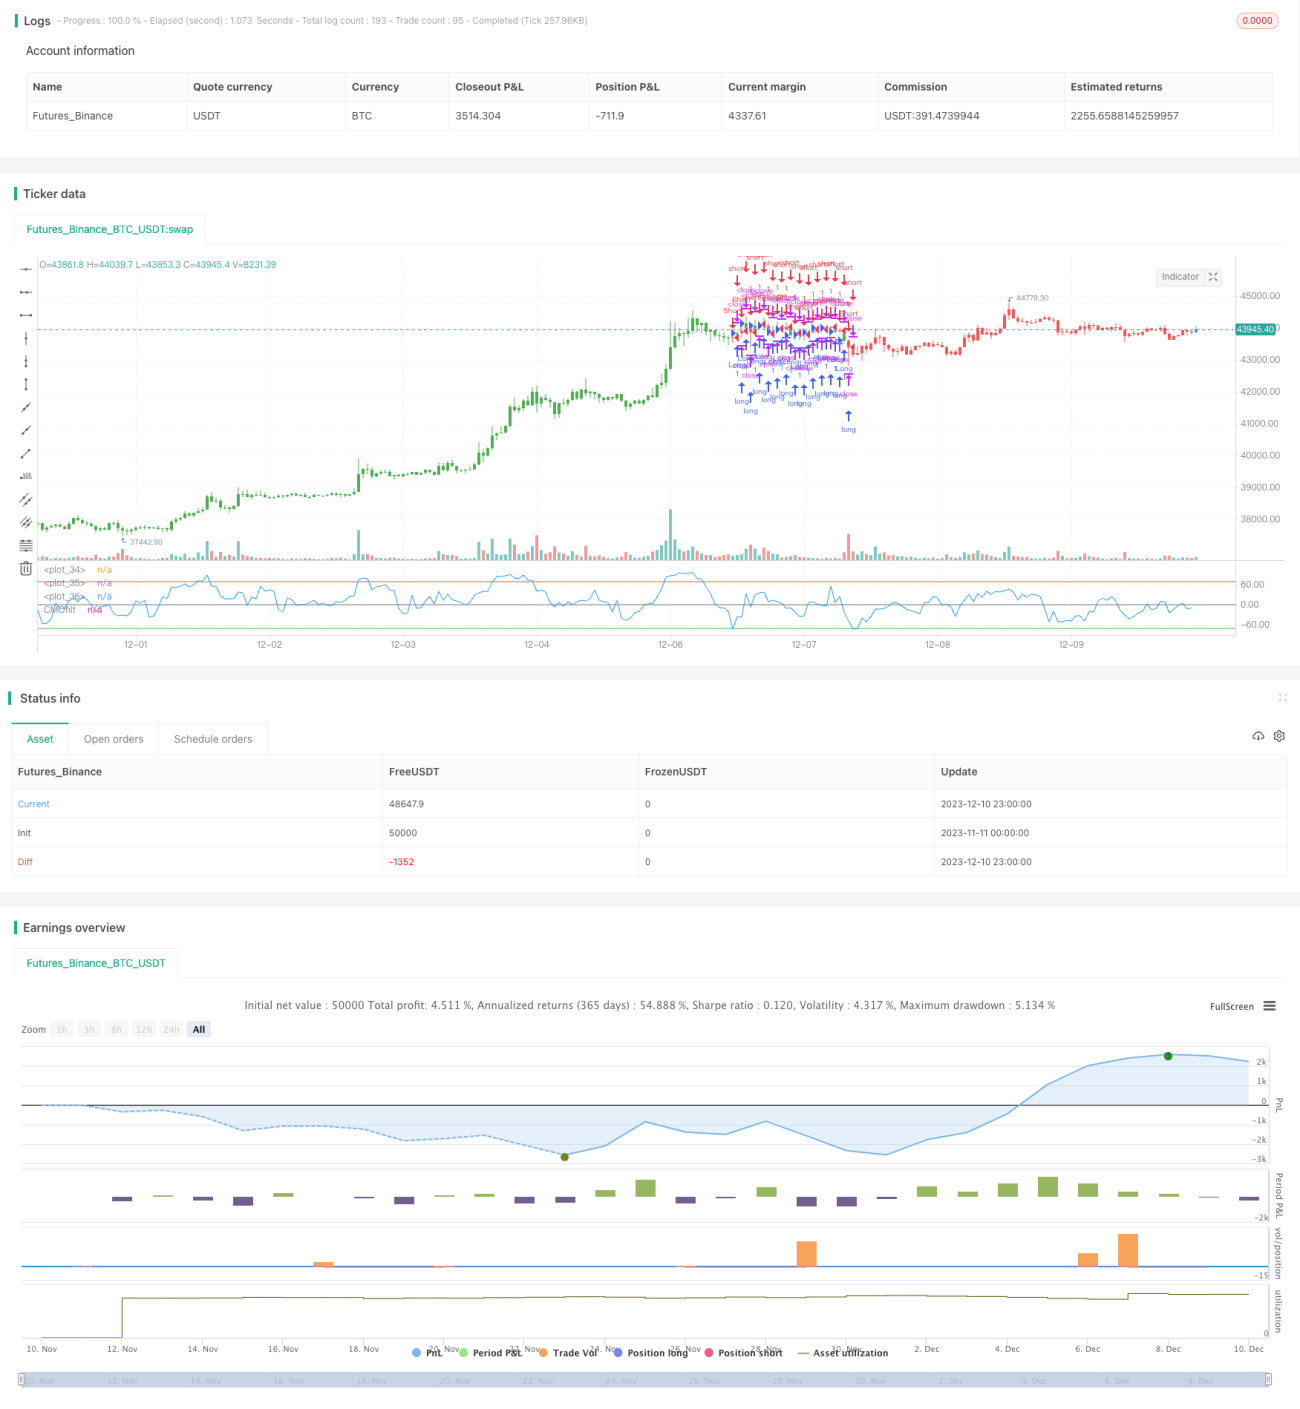
/*backtest
start: 2023-11-11 00:00:00
end: 2023-12-11 00:00:00
period: 1h
basePeriod: 15m
exchanges: [{"eid":"Futures_Binance","currency":"BTC_USDT"}]
*/

//@version=2
////////////////////////////////////////////////////////////
//  Copyright by HPotter v1.0 02/03/2017
// This indicator plots a CMO which ignores price changes which are less - 1