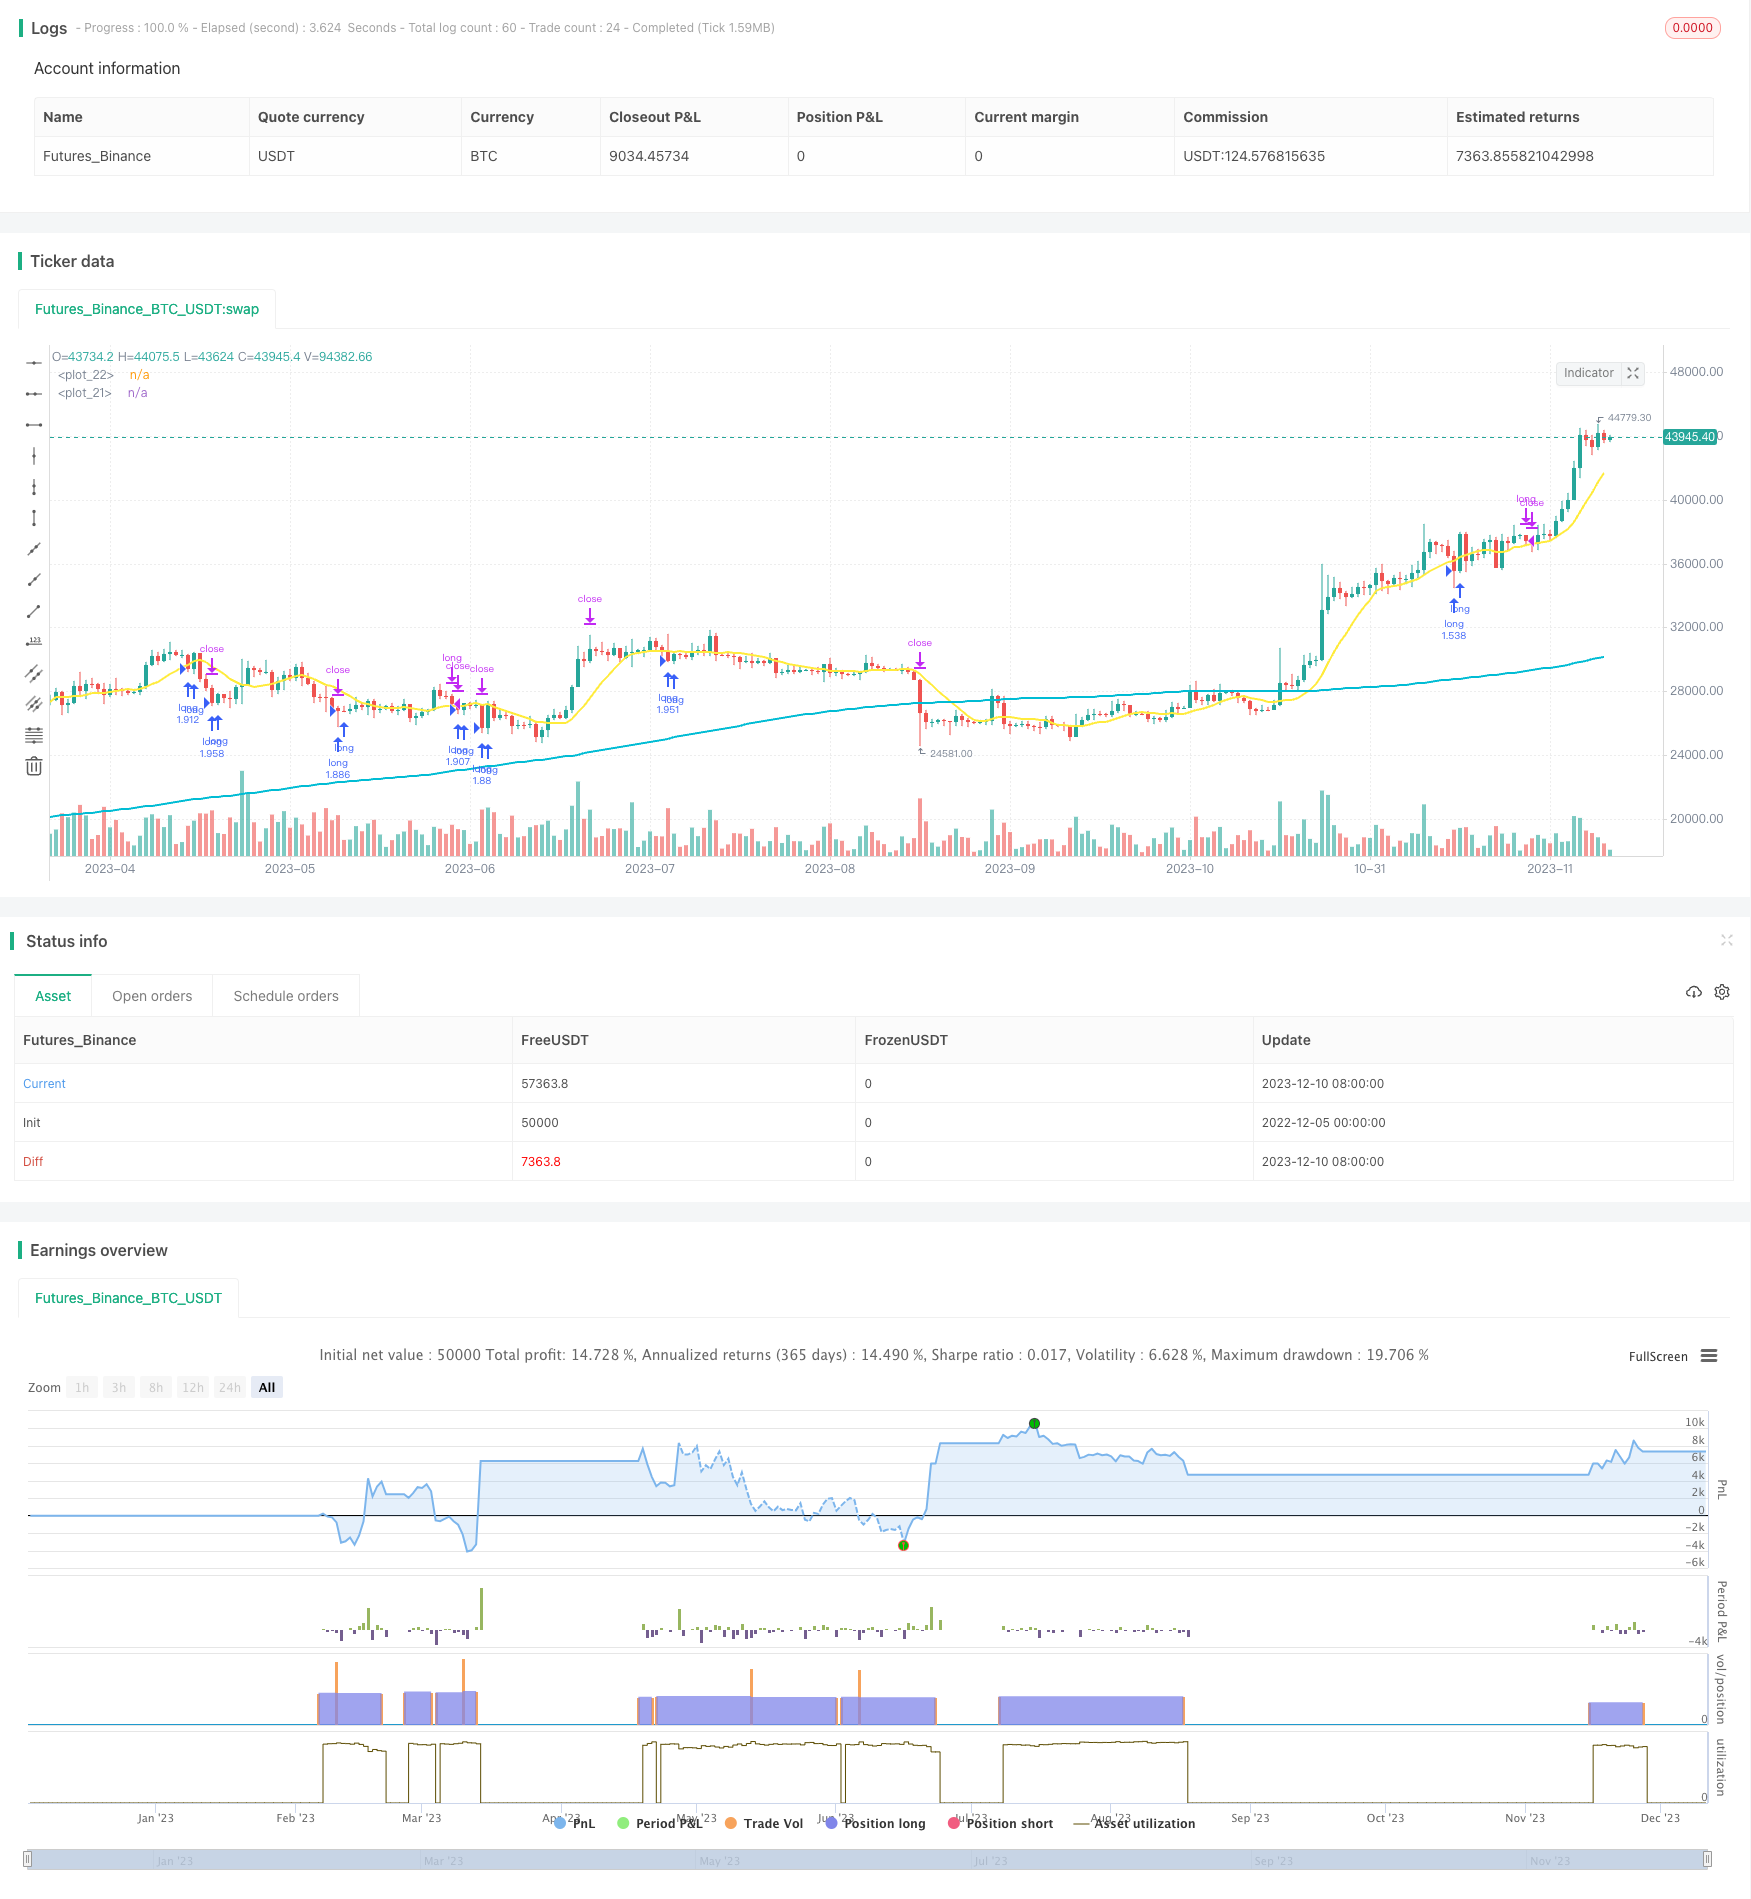
Simple Pullback Strategy Tracking Long Term Trends

Author: ChaoZhang, Date: 2023-12-12 15:32:15
Tags:

img

This strategy tracks long term trends and enters the market during short term pullbacks, achieving a simple trading logic of buying low and selling high.

Strategy Principle

When the close price is above the 200-day simple moving average, it indicates that the current market is in a long-term upward trend. When the close price is below the 10-day simple moving average and the RSI(3) is below 30, it indicates that the price has pulled back sharply in the short term. At this time, go long to track the long-term upward trend at a better price.

After taking a long position, set a stop loss and take profit. Specifically, the stop loss is set at 95% of the entry price, and the take profit is set at 120% of the entry price. When the price breaks through the 10-day line on the upside, take profit; when the price breaks below the low of the previous K-line, stop loss.

Advantage Analysis

The biggest advantage of this strategy is that by tracking long-term trends and choosing better entry points during short-term adjustments, it can achieve low-buying and high-selling. In the long run, stock indices are generally in an upward channel, and this strategy can effectively track long-term upward trends.

In the short term, the entry point selected by this strategy is in a short-term oversold stage, with a certain low-buying effect. RSI (3) below 30 indicates that the price has fallen continuously for three K-lines, which provides a better timing for entry.

Risk Analysis

Despite the protection of the stop loss mechanism, the biggest risk of this strategy still comes from the wrong judgment of the trend. If the long-term trend is judged wrong, it may encounter greater losses after entering the market. In addition, if the stop loss position is set too close, the risk may also increase.

One solution is to add more trend judgment indicators, such as ADX, to ensure that it is indeed in a trend state when entering the market. In addition, appropriately relax the stop loss range, such as expanding it to 90% of the entry price.

Optimization Directions

This strategy can be optimized in the following aspects:

  1. Add more trend judgment indicators to ensure more accurate judgments of short-term and long-term trends;

  2. Optimize the cycle parameters of the moving average to find the best parameter combination;

  3. Test different take profit and stop loss parameter settings to find the optimal parameter combination;

  4. Try adding other factors when entering the market, such as trading volume amplification, to improve entry efficiency.

Summary

The main idea of this strategy is to choose a better entry point during short-term adjustments while tracking long-term trends. Its biggest advantage is the optimization of entry price, which can achieve low-buying and high-selling to track long-term upward trends. At the same time, the strategy also considers risk control by setting a stop loss mechanism. Overall, this is a very simple, straightforward and easy to understand and implement trend tracking strategy. By optimizing some parameters and rules, the effect of the strategy can be further improved.


/*backtest
start: 2022-12-05 00:00:00
end: 2023-12-11 00:00:00
period: 1d
basePeriod: 1h
exchanges: [{"eid":"Futures_Binance","currency":"BTC_USDT"}]
*/

// This source code is subject to the terms of the Mozilla Public License 2.0 at https://mozilla.org/MPL/2.0/
// © tsujimoto0403

//@version=5
strategy("simple pull back", overlay=true,default_qty_type=strategy.percent_of_equity,
     default_qty_value=100)

//input value 
malongperiod=input.int(200,"長期移動平均BASE200/period of long term sma",group = "パラメータ")
mashortperiod=input.int(10,"長期移動平均BASE10/period of short term sma",group = "パラメータ")
stoprate=input.int(5,title = "損切の割合%/stoploss percentages",group = "パラメータ")
profit=input.int(20,title = "利食いの割合%/take profit percentages",group = "パラメータ")
startday=input(title="バックテストを始める日/start trade day", defval=timestamp("01 Jan 2000 13:30 +0000"), group="期間")
endday=input(title="バックテスを終わる日/finish date day", defval=timestamp("1 Jan 2099 19:30 +0000"), group="期間")


//polt indicators that we use 
malong=ta.sma(close,malongperiod)
mashort=ta.sma(close,mashortperiod)

plot(malong,color=color.aqua,linewidth = 2)
plot(mashort,color=color.yellow,linewidth = 2)

//date range 
datefilter = true

//open conditions
if close>malong and close<mashort and strategy.position_size == 0 and datefilter and ta.rsi(close,3)<30 
    strategy.entry(id="long", direction=strategy.long)
    
//sell conditions 
strategy.exit(id="cut",from_entry="long",stop=(1-0.01*stoprate)*strategy.position_avg_price,limit=(1+0.01*profit)*strategy.position_avg_price)


if close>mashort and close<low[1] and strategy.position_size>0
    strategy.close(id ="long")


More