Indirect Strength Index Strategy Based on RSI Indicator and 200-day SMA Filter

Overview
This strategy mainly uses the Relative Strength Index (RSI) indicator to judge overbought and oversold situations, and uses the 200-day Simple Moving Average (200 Day SMA) as the main price trend filter. On the basis of determining the trend direction, it uses the RSI indicator to find better entry and exit timing to achieve profitability. Compared with using the RSI indicator alone, this strategy increases trend judgment and can more accurately grasp market trends, chase rises and sell declines in a bull market, and do the opposite in a bear market, thereby obtaining higher strategy returns.
Strategy Principle
The strategy consists mainly of two parts: the RSI indicator and the 200-day SMA filter.
The RSI indicator section mainly judges whether the price has entered the overbought or oversold zone. Its calculation formula is:
RSI = 100 - 100 / (1 + Average gain of up days in RSI / Average loss of down days in RSI)
According to empirical parameters, when RSI < 30, it is oversold; when >70, it is overbought.
The 200-day SMA filter mainly judges the overall market trend direction. When the price is above the 200-day SMA, it is a bull market, otherwise it is a bear market.
Based on the above two judgments, the strategy has the following entry and exit logic:
Long entry: RSI < 45 and Close price > 200-day SMA
Long exit: RSI > 75 and Close price > 200-day SMA
Short entry: RSI > 65 and Close price < 200-day SMA
Short exit: RSI < 25 and Close price < 200-day SMA
Thus, the strategy uses the precise judgment of the RSI indicator to find better entry and exit points in the overall trend and thereby achieve higher returns.
Advantage Analysis
The biggest advantage of this strategy is using the combination of the RSI indicator and 200-day SMA filter to make the strategy more stable and precise:
- The 200-day SMA effectively judges the overall market trend and avoids misjudgments of single RSI indicators
- The RSI indicator can find better entry and exit points within the overall market trend
- The strategy operation is simple and easy to implement
In addition, the strategy also has the following advantages:
- Applicable to various products including stock indices, cryptocurrencies and precious metals
- High capital utilization efficiency
- Can cautiously add a stop loss to effectively control single losses
Risk Analysis
The strategy also has some risks:
- Sudden adjustments in the overall market may lead to greater losses
- There is some degree of lag in RSI and SMA indicators
- High trading frequency leads to higher trading costs
To control these risks, the following measures can be taken:
- Adjust position sizing appropriately to guard against impacts of unexpected events
- Optimize RSI and SMA parameters to reduce lag probability
- Adjust trading frequency appropriately to reduce trading costs
Optimization Directions
The strategy can be optimized in the following aspects:
- Dynamically adjust RSI parameters based on market volatility
- Test whether other moving average indicators like EMA can bring better results
- Increase automatic stop loss mechanism
- Add position sizing module to dynamically adjust positions based on capital
- Optimize entry and exit logic to test if better returns can be achieved
Conclusion
The overall performance of this strategy is good, with the advantages of accurate judgment, simple operation, and wide applicability. After adding stop loss and position sizing, it can be carefully run in live trading. Follow-up aspects like parameter optimization, stop loss optimization, position sizing can further enhance the strategy.
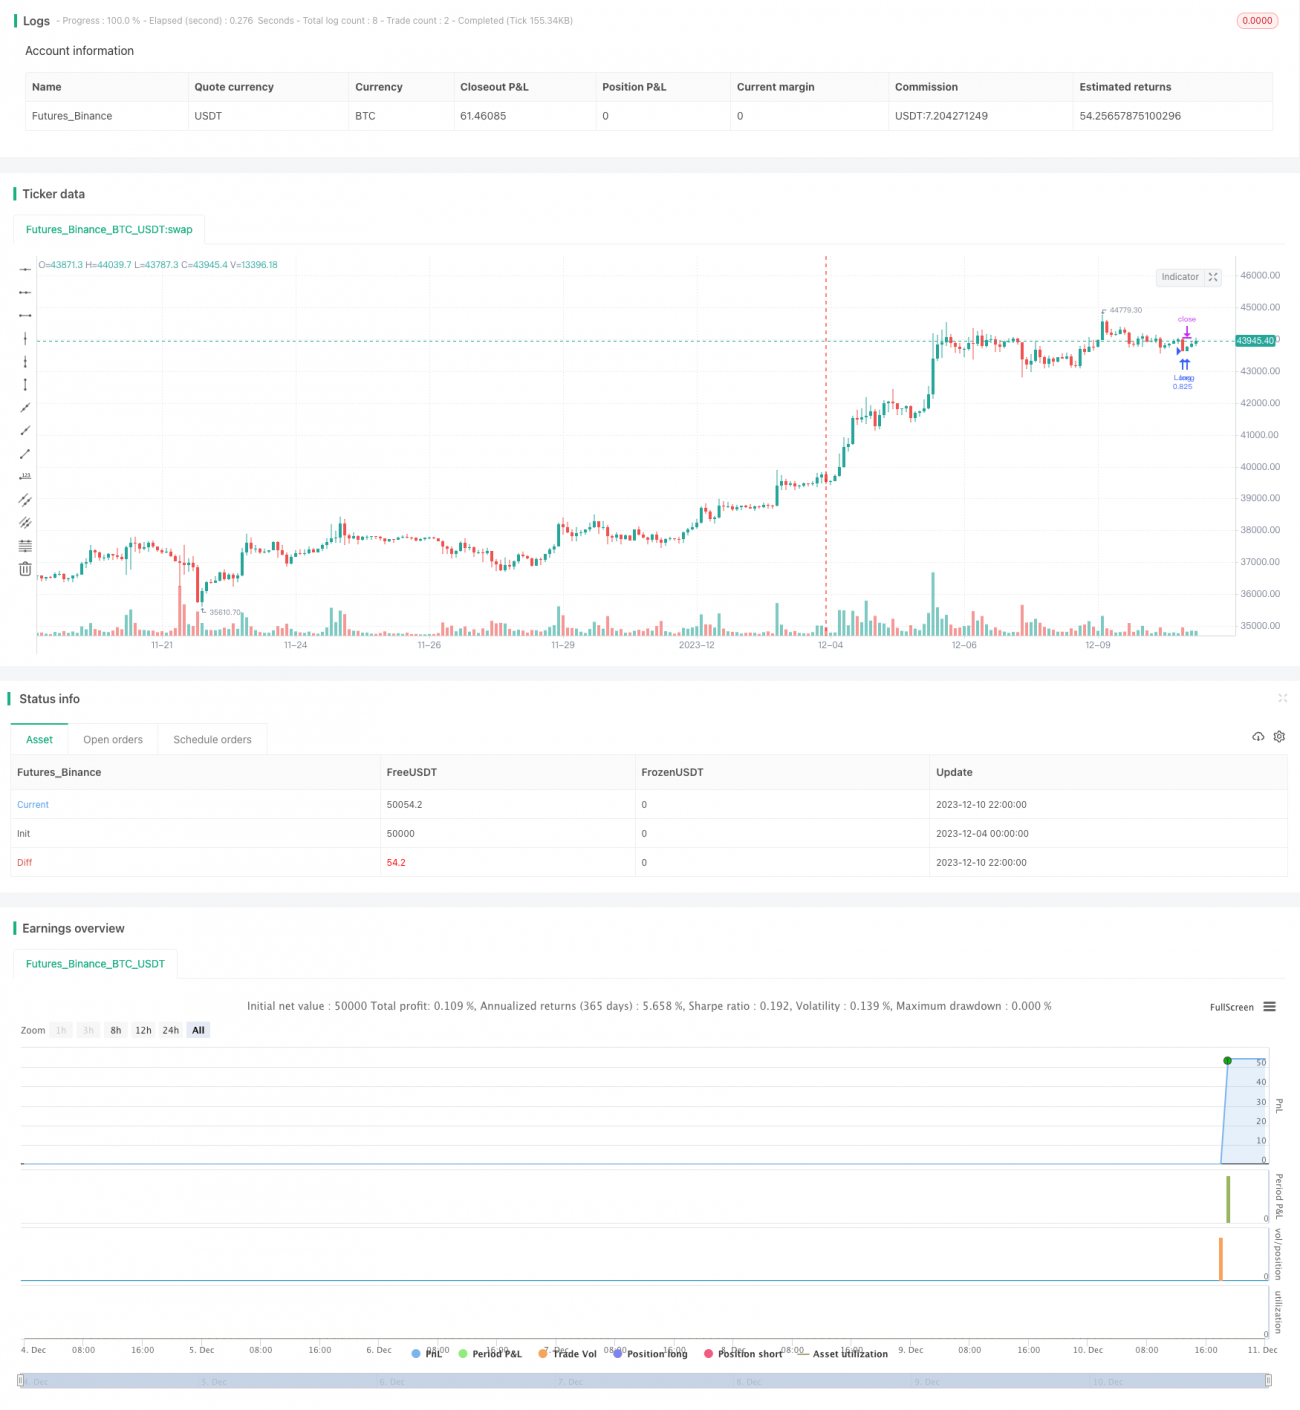
/*backtest
start: 2023-12-04 00:00:00
end: 2023-12-11 00:00:00
period: 2h
basePeriod: 15m
exchanges: [{"eid":"Futures_Binance","currency":"BTC_USDT"}]
*/

// This work is licensed under a Attribution-NonCommercial-ShareAlike 4.0 International (CC BY-NC-SA 4.0) https://creativecommons.org/licenses/by-nc-sa/4.0/
// © LuxAlgo

//@version=5- 1