Advanced SuperTrend Tracking Strategy

The strategy uses the SuperTrend indicator to determine the trend direction and combines the ATR indicator to set stop loss and take profit to achieve low risk trend following.
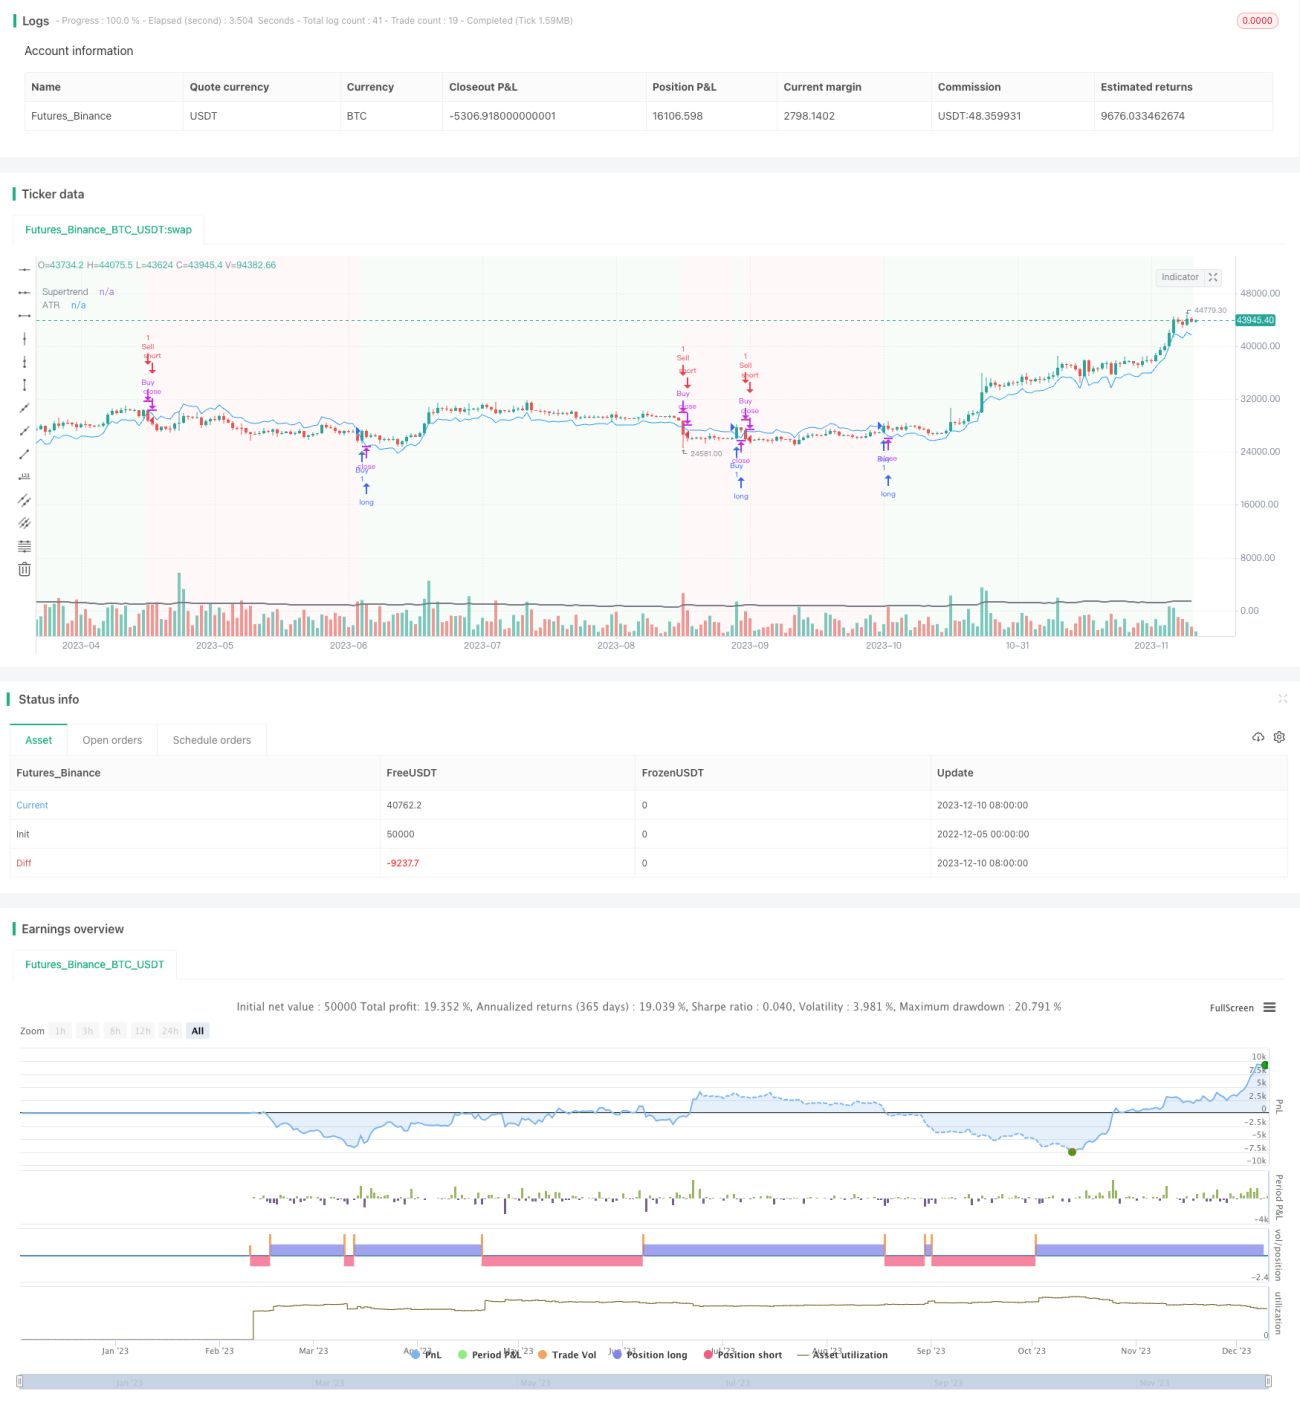
Strategy Principle
The core indicator of this strategy is SuperTrend. SuperTrend indicator combines ATR to judge the trend direction based on price breakthroughs. The specific calculation method is as follows:
Upper Band: Upper Band = Current Price - (ATR x Multiplier)
Lower Band: Lower Band = Current Price + (ATR x Multiplier)
When the price is higher than the upper band, it is an uptrend; when the price is lower than the lower band, it is a downtrend.
The strategy determines the trend direction based on the SuperTrend indicator, goes long in an uptrend and goes short in a downtrend. At the same time, the strategy uses the average fluctuation range of the ATR indicator to set stop loss and take profit positions to control risks.
Advantages of the Strategy
- Use SuperTrend indicator to determine the trend and accurately capture market trends
- ATR stop loss and take profit effectively controls single loss
- Combining trend and stop loss realizes overall high winning rate trading
- Easy to enter the market and easy to stop loss, suitable for short term tracking
Risks of the Strategy
- SuperTrend indicator has repaint problems, cannot completely rely on signals to enter the market
- ATR indicator cannot completely adapt to violent fluctuations, stop loss is too close and tends to be stopped out
- The strategy itself cannot judge the quality of the trend and requires manual verification
Risk Mitigation Methods:
- Manually verify the quality of the trend to avoid reverse operations during false breakouts
- Appropriately loosen the stop loss point to prevent being stopped out by small fluctuations during normal volatility
Optimization Directions
- Increase multifactor verification to judge trend quality
- Combine volatility indicators to dynamically adjust ATR parameters
- Add machine learning models to assist in judging entry and exit timing
- Optimize stop loss mechanism to prevent normal fluctuations from being stopped out
In summary, this strategy uses the SuperTrend indicator to determine the trend direction and sets stop loss and take profit with the ATR indicator to achieve low risk trend following trading. The strategy idea is clear and easy to understand. Parameters can be adjusted according to personal risk preferences. It is a versatile trend tracking strategy. However, the strategy itself cannot judge the quality of the trend, so it is recommended to use with other indicators or models to reduce the risk of misoperation.
- 1