トレーリングストップ付き単一指数移動平均トレンドフォロー戦略
作成日:
2024-01-08 11:37:44
最終変更日:
2024-01-08 11:37:44
コピー:
1
クリック数:
801
1
フォロー
1750
フォロワー
概要
この戦略は,単一指数平行移動平均 ((SESMA) と付随する追随の止損のドンチ階周回メカニズムを組み合わせて,非常に安定し,効率的なトレンド追跡戦略を形成する.価格のトレンド方向を識別するために,SESMAが主線として使用されます.追随の止損メカニズムは,戦略のリスクを効果的に軽減し,同時に戦略の利益を保護します.
戦略原則
この戦略は2つの主要指標で構成されています.
シングルインデックス・スムーズ・ムービング・アベアンス (SESMA):SESMAはEMAの考え方を借り,同時にパラメータを改良し,曲線をより滑らかにし,遅延を減らす.SESMAの方向と価格関係によって価格の傾向を判断する.
尾行ストップメカニズム:最高価格,最低価格およびATR指標を組み合わせて,多頭と空頭のストップラインをリアルタイムで計算する. これは,市場の変動性とトレンドに応じてストップ損失の幅を調整できるダイナミックに調整されたストップメカニズムである. ストップラインと価格の関係が平線からの退出のタイミングを判断するために使用される.
この戦略の入場基点は,価格がSESMAを突破することであり,出場シグナルは,ストップ・ロスのラインによって誘発される.標識が表示されるかどうかを設定することができる.
戦略的優位性
- SESMAの計算方法の改善により,遅延を効果的に削減し,順位を把握する能力を向上させることができる.
- 尾行ストップメカニズムは,リアルタイム波動に応じてストップ幅を調整し,ストップを過度に緩やかまたは過度に緊密にするのを避ける.
- EntryとExitのタイミングを判定する補助視的マーカー.
- 各種とパラメータの最適化に対応するカスタマイズ可能なパラメータ.
リスクと最適化方向
- トレンドが逆転したときに,ストップが引き出され,早期退出を引き起こす可能性があります. ストップの幅は適切に緩和できます.
- SESMAのパラメータは最適の長さを見つけるために最適化できます.
- ATRパラメータは,異なる周期長さをテストすることもできます.
- テストで標識の効果が示されたか
要約する
この戦略は,トレンド判断とリスク制御指標を統合して,より堅牢なトレンド追跡戦略を形成する.単純な移動平均戦略と比較して,この戦略は,トレンドをより柔軟に捉え,逆転を減らすことができます.パラメータを最適化することで,戦略は,異なる市場でより良い効果を上げることができます.
ストラテジーソースコード
/*backtest
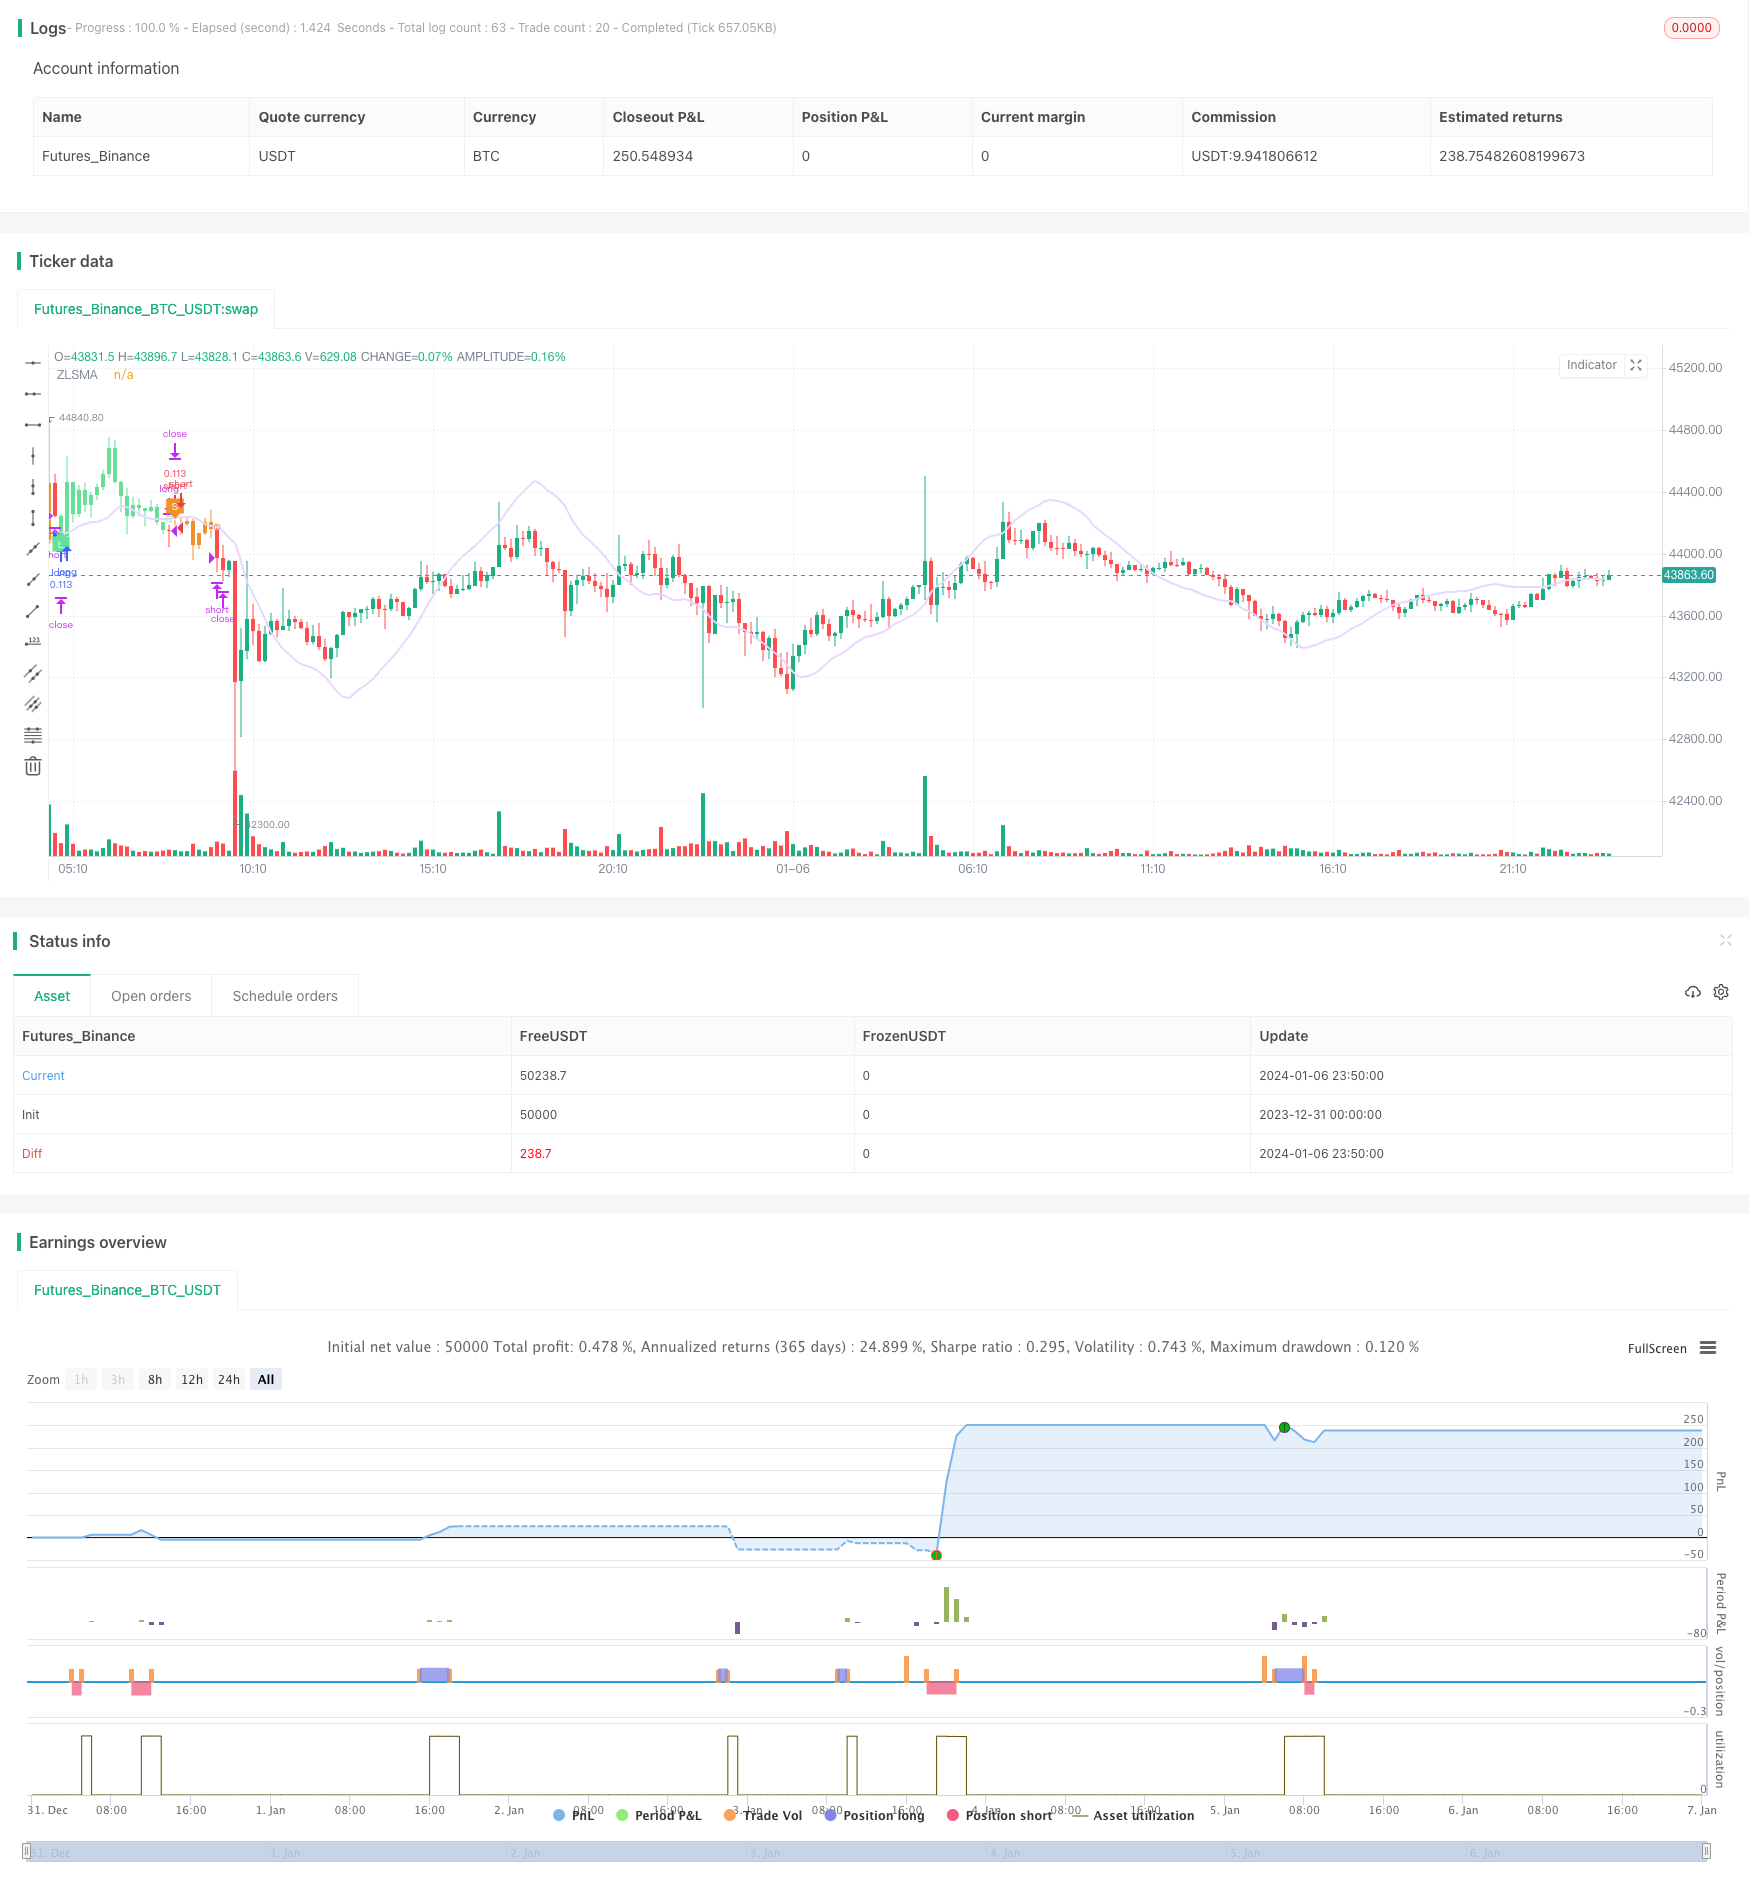
start: 2023-12-31 00:00:00
end: 2024-01-07 00:00:00
period: 10m
basePeriod: 1m
exchanges: [{"eid":"Futures_Binance","currency":"BTC_USDT"}]
*/
//@version=5
// This source code is subject to the terms of the Mozilla Public License 2.0 at https://mozilla.org/MPL/2.0/
// © simwai
strategy('Chandelier Exit ZLSMA Strategy', shorttitle='CE_ZLSMA', overlay = true, initial_capital = 1000, default_qty_value = 10, default_qty_type = strategy.percent_of_equity, calc_on_every_tick = false, process_orders_on_close = true, commission_value = 0.075)
// -- Colors --
color maximumYellowRed = color.rgb(255, 203, 98) // yellow
color rajah = color.rgb(242, 166, 84) // orange
color magicMint = color.rgb(171, 237, 198)
color languidLavender = color.rgb(232, 215, 255)
color maximumBluePurple = color.rgb(181, 161, 226)
color skyBlue = color.rgb(144, 226, 244)
color lightGray = color.rgb(214, 214, 214)
color quickSilver = color.rgb(163, 163, 163)
color mediumAquamarine = color.rgb(104, 223, 153)
color carrotOrange = color.rgb(239, 146, 46)
// -- Inputs --
length = input(title='ATR Period', defval=1)
mult = input.float(title='ATR Multiplier', step=0.1, defval=2)
showLabels = input(title='Show Buy/Sell Labels ?', tooltip='Created by Chandelier Exit (CE)', defval=false)
isSignalLabelEnabled = input(title='Show Signal Labels ?', defval=true)
useClose = input(title='Use Close Price for Extrema ?', defval=true)
zcolorchange = input(title='Enable Rising/Decreasing Highlightning', defval=false)
zlsmaLength = input(title='ZLSMA Length', defval=50)
offset = input(title='Offset', defval=0)
// -- CE - Credits to @everget --
float haClose = float(1) / 4 * (open[1] + high[1] + low[1] + close[1])
atr = mult * ta.atr(length)[1]
longStop = (useClose ? ta.highest(haClose, length) : ta.highest(haClose, length)) - atr
longStopPrev = nz(longStop[1], longStop)
longStop := haClose > longStopPrev ? math.max(longStop, longStopPrev) : longStop
shortStop = (useClose ? ta.lowest(haClose, length) : ta.lowest(haClose, length)) + atr
shortStopPrev = nz(shortStop[1], shortStop)
shortStop := haClose < shortStopPrev ? math.min(shortStop, shortStopPrev) : shortStop
var int dir = 1
dir := haClose > shortStopPrev ? 1 : haClose < longStopPrev ? -1 : dir
buySignal = dir == 1 and dir[1] == -1
plotshape(buySignal and showLabels ? longStop : na, title='Buy Label', text='Buy', location=location.absolute, style=shape.labelup, size=size.tiny, color=mediumAquamarine, textcolor=color.white)
sellSignal = dir == -1 and dir[1] == 1
plotshape(sellSignal and showLabels ? shortStop : na, title='Sell Label', text='Sell', location=location.absolute, style=shape.labeldown, size=size.tiny, color=carrotOrange, textcolor=color.white)
changeCond = dir != dir[1]
// -- ZLSMA - Credits to @netweaver2011 --
lsma = ta.linreg(haClose, zlsmaLength, offset)
lsma2 = ta.linreg(lsma, zlsmaLength, offset)
eq = lsma - lsma2
zlsma = lsma + eq
zColor = zcolorchange ? zlsma > zlsma[1] ? magicMint : rajah : languidLavender
plot(zlsma, title='ZLSMA', linewidth=2, color=zColor)
// -- Signals --
var string isTradeOpen = ''
var string signalCache = ''
bool enterLong = buySignal and ta.crossover(haClose, zlsma)
bool exitLong = ta.crossunder(haClose, zlsma)
bool enterShort = sellSignal and ta.crossunder(haClose, zlsma)
bool exitShort = ta.crossover(haClose, zlsma)
if (signalCache == 'long entry')
signalCache := ''
enterLong := true
else if (signalCache == 'short entry')
signalCache := ''
enterShort := true
if (isTradeOpen == '')
if (exitShort and (not enterLong))
exitShort := false
if (exitLong and (not enterShort))
exitLong := false
if (enterLong and exitShort)
isTradeOpen := 'long'
exitShort := false
else if (enterShort and exitLong)
isTradeOpen := 'short'
exitLong := false
else if (enterLong)
isTradeOpen := 'long'
else if (enterShort)
isTradeOpen := 'short'
else if (isTradeOpen == 'long')
if (exitShort)
exitShort := false
if (enterLong)
enterLong := false
if (enterShort and exitLong)
enterShort := false
signalCache := 'short entry'
if (exitLong)
isTradeOpen := ''
else if (isTradeOpen == 'short')
if (exitLong)
exitLong := false
if (enterShort)
enterShort := false
if (enterLong and exitShort)
enterLong := false
signalCache := 'long entry'
if (exitShort)
isTradeOpen := ''
plotshape((isSignalLabelEnabled and enterLong) ? zlsma : na, title='LONG', text='L', style=shape.labelup, color=mediumAquamarine, textcolor=color.white, size=size.tiny, location=location.absolute)
plotshape((isSignalLabelEnabled and enterShort) ? zlsma : na, title='SHORT', text='S', style=shape.labeldown, color=carrotOrange, textcolor=color.white, size=size.tiny, location=location.absolute)
plotshape((isSignalLabelEnabled and exitLong) ? zlsma : na, title='LONG EXIT', style=shape.circle, color=magicMint, size=size.tiny, location=location.absolute)
plotshape((isSignalLabelEnabled and exitShort) ? zlsma : na, title='SHORT EXIT', style=shape.circle, color=rajah, size=size.tiny, location=location.absolute)
barcolor(color=isTradeOpen == 'long' ? mediumAquamarine : isTradeOpen == 'short' ? carrotOrange : na)
// -- Long Exits --
if (exitLong and strategy.position_size > 0)
strategy.close('long', comment='EXIT_LONG')
// -- Short Exits --
if (exitShort and strategy.position_size < 0)
strategy.close('short', comment='EXIT_SHORT')
// -- Long Entries --
if (enterLong)
strategy.entry('long', strategy.long, comment='ENTER_LONG')
// -- Short Entries --
if (enterShort)
strategy.entry('short', strategy.short, comment='ENTER_SHORT')