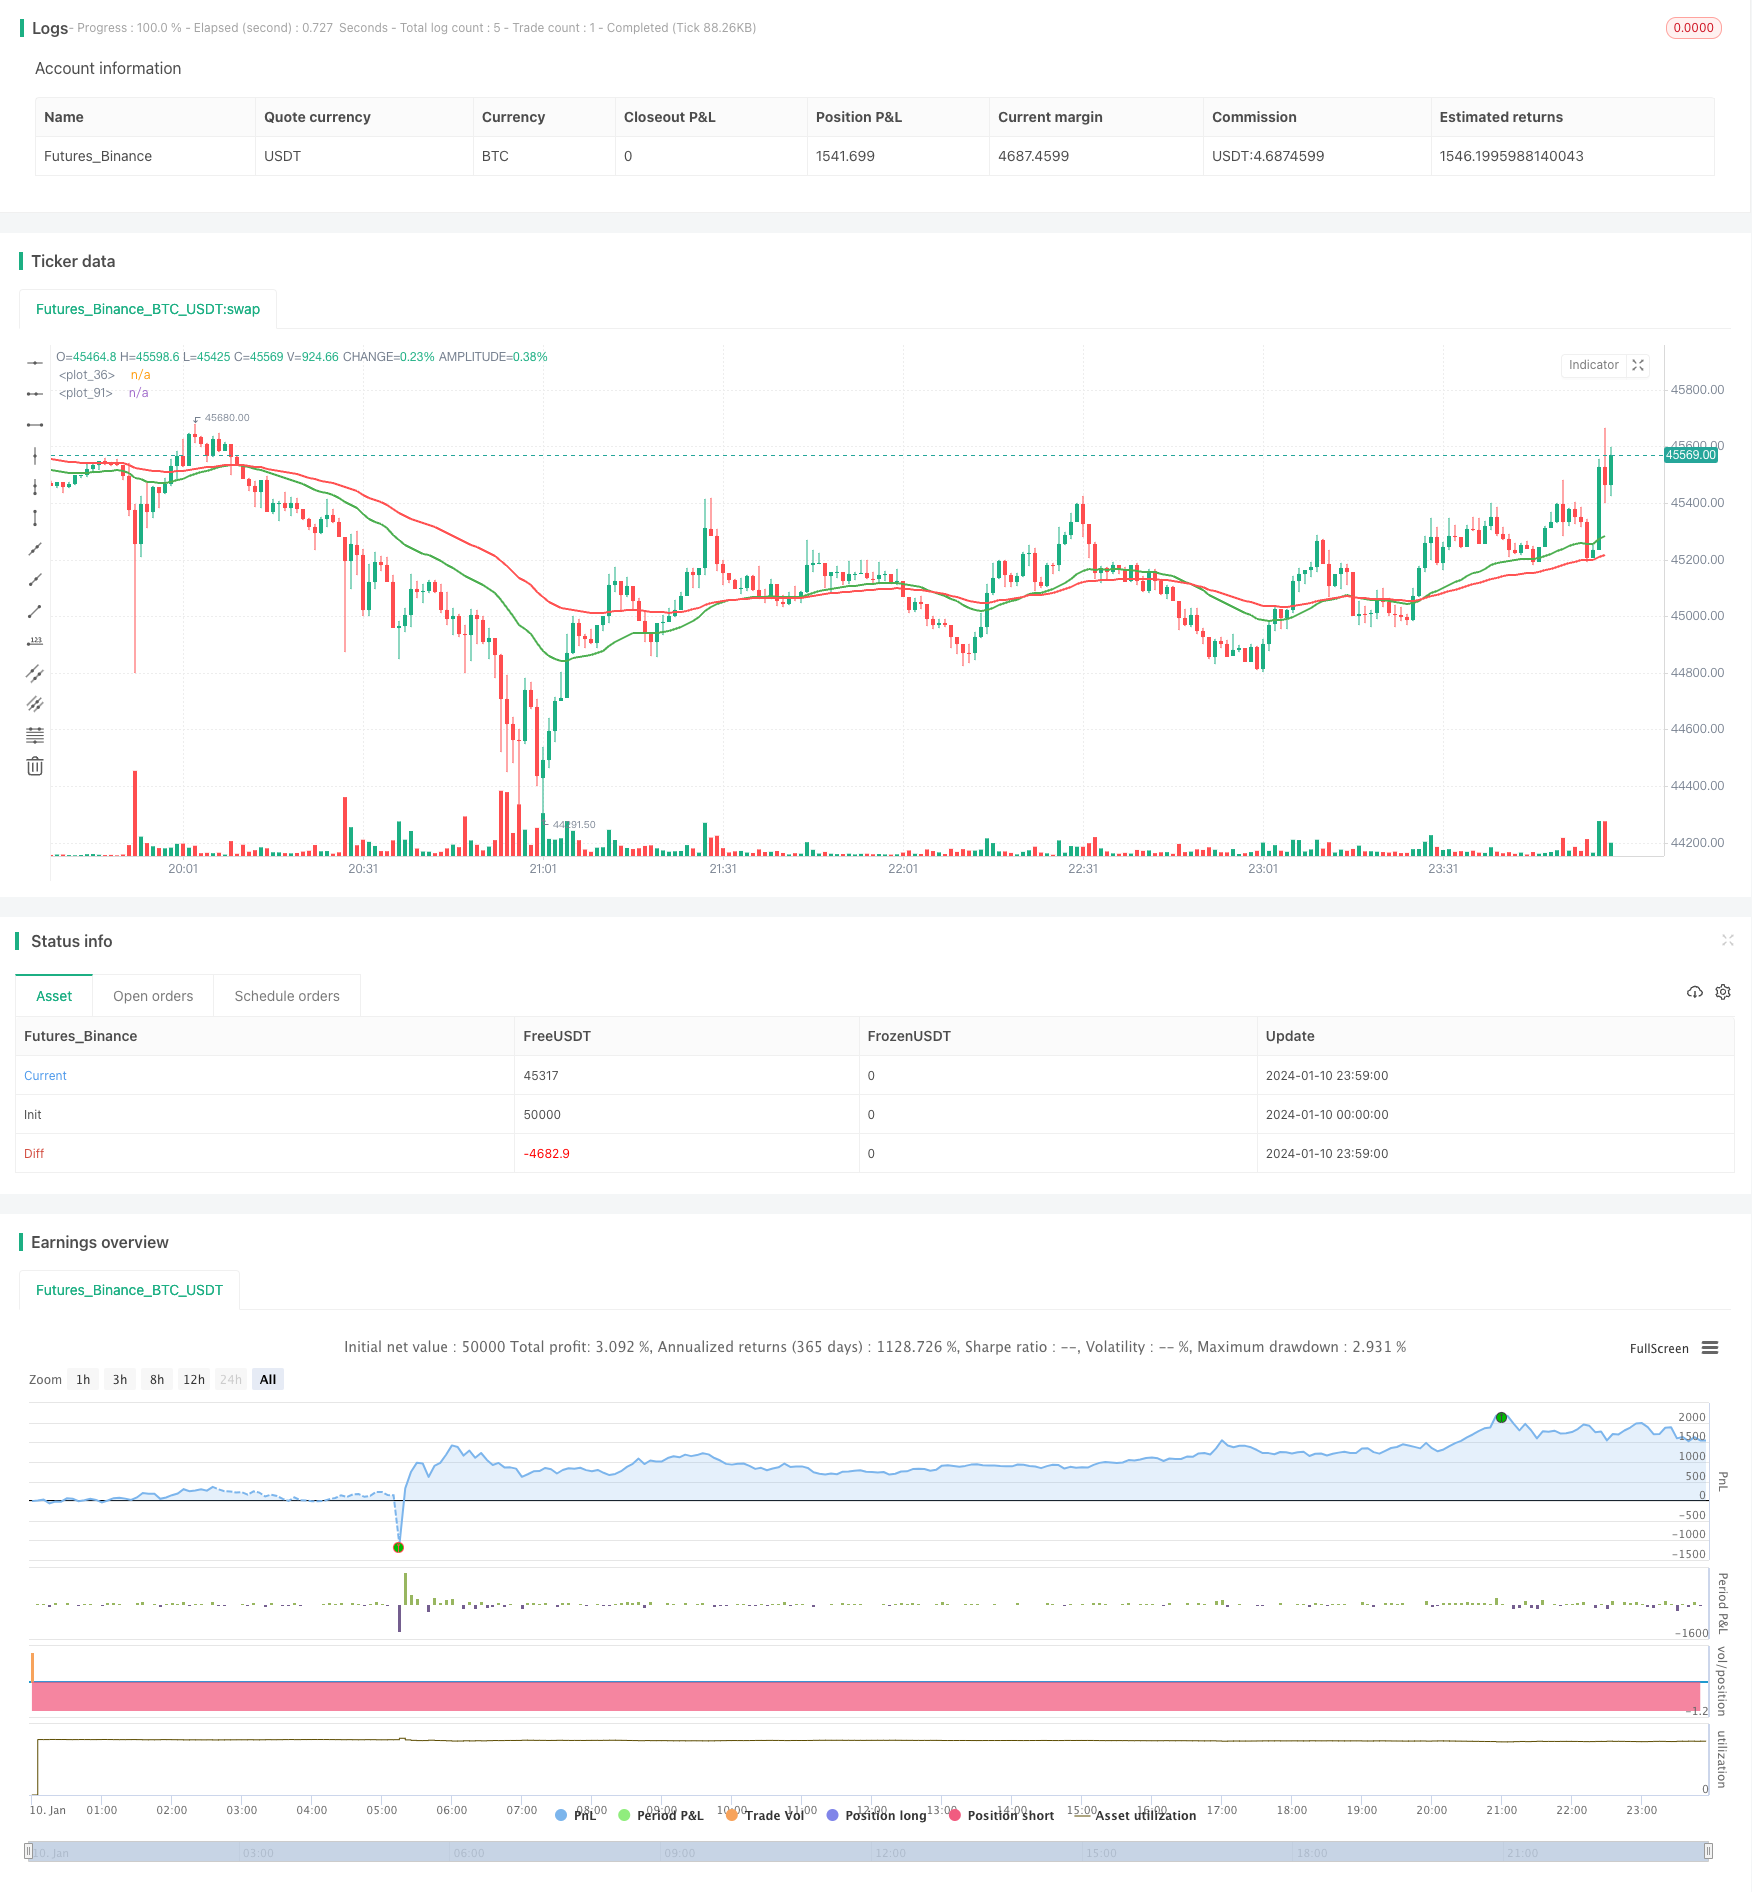
典型的なトレンドフォロー戦略
作成日:
2024-01-12 14:59:18
最終変更日:
2024-01-12 14:59:18
コピー:
3
クリック数:
646
1
フォロー
1664
フォロワー

概要
双均線交差策略は,典型的なトレンド追跡策略である.これは,2つの異なる周期のEMA平均線を利用し,短周期平均線上を長周期平均線に横切るときに多し,短周期平均線下を長周期平均線に横切るときに空きして,価格トレンドの転換点を捕捉する.
戦略原則
この戦略の核心指標は,30周期および60周期の2つのEMA平均線である.コードでは,カスタム関数を使用して2つのEMA平均線を計算します.
emaLen1 = emaFuncOne(close, lenMA1)
emaLen2 = emaFuncTwo(close, lenMA2)
戦略の取引シグナルは,二つのEMA均線の交差点からのものです.
currentState = if emaLen2 > emaLen1
    0
else
    1

previousState = if emaLastLen2 > emaLastLen1
    0
else
    1

convergence = if currentState != previousState
    1
else
    0
短期EMA上での長期EMA穿戴時に,currentStateはpreviousStateと等しくない,交差信号が発生する。このとき,多行する。 短期EMAの下から長期EMAを通過すると,currentStateとpreviousStateは等しくない,交差信号が発生する。このとき空置する。
優位分析
この戦略の利点は以下の通りです.
- 戦略はシンプルで直感的で,理解し,実行しやすい.
- EMA均線の平滑性を利用して,市場騒音を効果的にフィルターする
- トレンドを自動で追跡し,買い落としを避ける
リスク分析
この戦略にはいくつかのリスクがあります.
- 交差点の信号が遅れて,ターニングを間に合わない可能性がある.
- 震災の際に複数の誤信号が発生する可能性があります.
- パラメータを正しく設定しない場合,過度に敏感または過度に遅滞する可能性があります.
EMA周期を調整したり,フィルタリング条件を追加したりすることで最適化できます.
最適化の方向
この戦略は以下の点で最適化できます.
- 異なる長さのEMA周期の組み合わせをテストする
- 取引量または波動率を増加させる条件で偽信号をフィルターする
- MACDなどの他の指標と組み合わせたトレンド確認
- 資金管理を最適化し,ストップ・ローズを設定する
要約する
双均線交差戦略は,全体としてシンプルで実用的なトレンド追跡戦略である.それはストレート・フォワードで,実行しやすいので,自動でトレンドを追跡することができる.しかし,いくつかの遅滞,偽信号の危険性もある.パラメータを最適化し,フィルタリング条件を追加することで,さらに完善し,それを量化取引の基本戦略の1つにすることができる.
ストラテジーソースコード
/*backtest
start: 2024-01-10 00:00:00
end: 2024-01-11 00:00:00
period: 1m
basePeriod: 1m
exchanges: [{"eid":"Futures_Binance","currency":"BTC_USDT"}]
*/

//@version=2
strategy("ParkerMAStrat", overlay=true)

lenMA1=input(title="Length 1", defval=30)
lenMA2=input(title="Length 2",  defval=60)

x = 0

checkLines(current, last) =>

    if current > last
        x = 1
    else
        x = 0
    x


//plot ema based on len1
emaFuncOne(src, time_period) =>

    alpha = 2 / (time_period + 1)
    // we have defined the alpha function above
    ema = 0.0
    // this is the initial declaration of ema, since we dont know the first ema we will declare it to 0.0 [as a decimal]
    ema := alpha * src + (1 - alpha) * nz(ema[1])
    // this returns the computed ema at the current time
    // notice the use of : (colon) symbol before =, it symbolises, that we are changing the value of ema,
    // since the ema was previously declared to 0
    // this is called mutable variale declaration in pine script
    ema
    // return ema from the function

emaLen1 = emaFuncOne(close, lenMA1)


plot(emaLen1, color=green, transp=0, linewidth=2)
// now we plot the _10_period_ema

//plot ema based on len2
emaFuncTwo(src, time_period) =>

    alpha = 2 / (time_period + 1)
    // we have defined the alpha function above
    ema = 0.0
    // this is the initial declaration of ema, since we dont know the first ema we will declare it to 0.0 [as a decimal]
    ema := alpha * src + (1 - alpha) * nz(ema[1])
    // this returns the computed ema at the current time
    // notice the use of : (colon) symbol before =, it symbolises, that we are changing the value of ema,
    // since the ema was previously declared to 0
    // this is called mutable variale declaration in pine script
    ema
    // return ema from the function

//plot ema based on len2
emaFuncOneLast(src, time_period) =>

    alpha = 2 / (time_period + 1)
    // we have defined the alpha function above
    ema = 0.0
    // this is the initial declaration of ema, since we dont know the first ema we will declare it to 0.0 [as a decimal]
    ema := alpha * src + (1 - alpha) * nz(ema[0])
    // this returns the computed ema at the current time
    // notice the use of : (colon) symbol before =, it symbolises, that we are changing the value of ema,
    // since the ema was previously declared to 0
    // this is called mutable variale declaration in pine script
    ema
    // return ema from the function

//plot ema based on len2
emaFuncTwoLast(src, time_period) =>

    alpha = 2 / (time_period + 1)
    // we have defined the alpha function above
    ema = 0.0
    // this is the initial declaration of ema, since we dont know the first ema we will declare it to 0.0 [as a decimal]
    ema := alpha * src + (1 - alpha) * nz(ema[0])
    // this returns the computed ema at the current time
    // notice the use of : (colon) symbol before =, it symbolises, that we are changing the value of ema,
    // since the ema was previously declared to 0
    // this is called mutable variale declaration in pine script
    ema
    // return ema from the function


emaLastLen1 = emaFuncOneLast(close, lenMA1)
emaLastLen2 = emaFuncTwoLast(close, lenMA2)
emaLen2 = emaFuncTwo(close, lenMA2)


plot(emaLen2, color=red, transp=30, linewidth=2)
// now we plot the _10_period_ema

//now we compare the two and when green crosses red we buy/sell (line1 vs line2)

previousState = if emaLastLen2 > emaLastLen1
    0
else
    1

currentState = if emaLen2 > emaLen1
    0
else
    1

convergence = if currentState != previousState
    1
else
    0


lineCheck = if convergence == 1
    checkLines(currentState, previousState)

if lineCheck == 1
    strategy.entry("Long", strategy.long)
else
    strategy.entry("Short", strategy.short)