ダイナミック CCI サポートとレジスタンス戦略
概要
この戦略は,CCI指標のハブポイントを使用して,ダイナミックなサポートとレジスタンス値を計算し,トレンド判断と組み合わせて,買入と売却のシグナルを探します. この戦略は,CCIの逆転特性とトレンド追跡能力を融合し,中期トレンドの逆転点を捕捉して利益を得ることを目的としています.
戦略原則
CCI指標は,市場が過弱または過強であるかどうかを示すことができる.80と80の2つの極限値は,市場が過買過売状態に入っているかどうかを判断するために使用される.この戦略は,CCIのこの特性を利用し,左側と左側の各50K線の枢纽を計算することによって,上枢纽と下枢纽を取得し,そして枢纽の基礎に減速衝動区のダイナミックな抵抗線とサポート線を構築する.
クローズアップ価格がオープニング価格より高く,上位サポートラインより低ければ買入シグナルが生成され,クローズアップ価格がオープニング価格より低く,下位レジスタンスラインより高くなったら売りシグナルが生成されます. 非主流のトレンド方向をフィルターするために,戦略はEMAと斜率指標を組み合わせて,現在の主流のトレンド方向を判断します. トレンドが多頭であると判断された場合にのみ買入操作が行われ,トレンドが空頭であると判断された場合にのみ売り操作が行われます.
ストップ・ロッドとストップ・ストップはATR指標の動的計算に基づいているため,この戦略のリスク管理も合理的です.
優位分析
- CCIの反転特性を活用して,反転点の近くで取引を選択し,利益の確率を高めます.
- トレンド判断と相まって逆行を避け,損失を減らす.
- ダイナミック・ストップ・ストップの設定は,リスク管理を合理的にします.
- CCI周期,バッファローズサイズなどのカスタマイズ可能なパラメータは,より多くの市場環境に対応します.
リスク分析
- CCIは偽信号を発生しやすいため,トレンドフィルタリングを組み合わせる必要があります.
- 逆転が成功するとは限らないので,一定確率で損失のリスクがある.
- パラメータの設定を間違えた場合,取引が頻繁になり,取引機会が逃れることがあります.
パラメータの最適化,ストップの幅の調整などの方法によってリスクを減らすことができます. さらに,この戦略は,他の指標の補助ツールとして,その取引信号に完全に依存する必要はありません.
最適化の方向
- バージョンのサイズを最適化して,変動する市場に対応する.
- ATRサイクルパラメータを最適化して,より正確な動的止損停止を図る.
- CCI パラメータの設定を試してください.
- 他のタイプのトレンド判断指標の効果をテストする.
要約する
この戦略は,CCI指標の多空選能力とトレンド判断のフィルター確認を統合し,実戦的な価値を有している.ダイナミックな止損停止は,戦略を実際のアプリケーションでリスク管理可能なものにもする.パラメータの最適化および改善により,より良い効果が得られる見込みである.
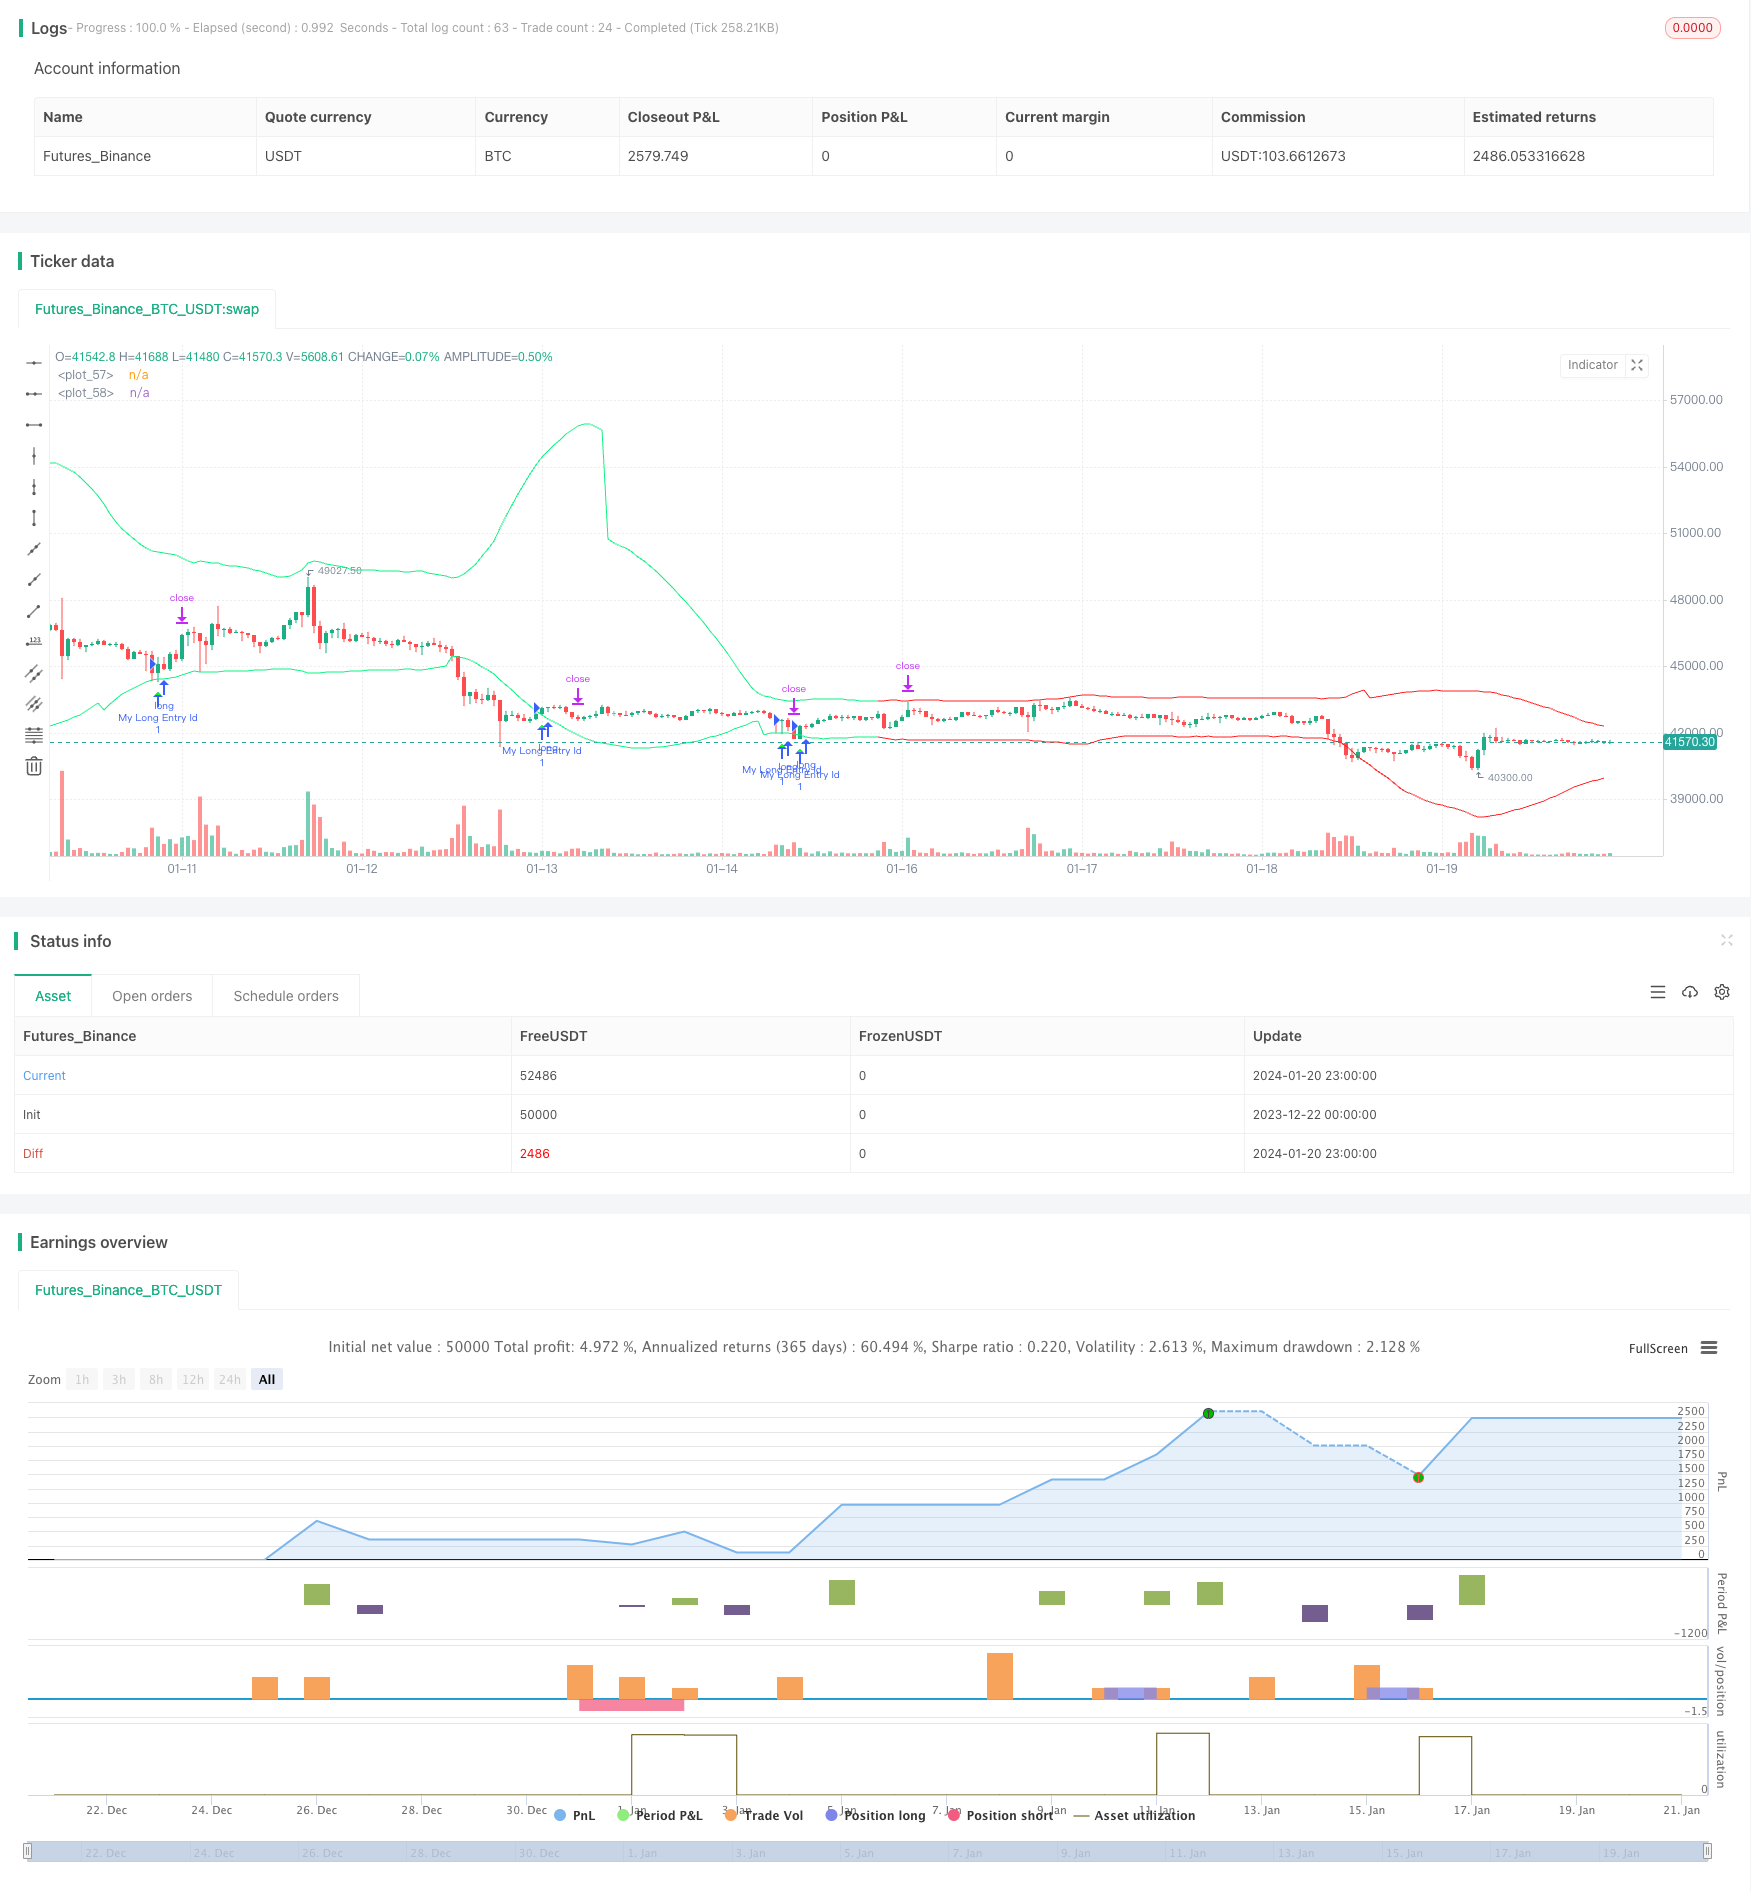
/*backtest
start: 2023-12-22 00:00:00
end: 2024-01-21 00:00:00
period: 1h
basePeriod: 15m
exchanges: [{"eid":"Futures_Binance","currency":"BTC_USDT"}]
*/

// This Pine Script™ code is subject to the terms of the Mozilla Public License 2.0 at https://mozilla.org/MPL/2.0/
// © AliSignals


//@version=5
strategy("CCI based support and resistance strategy", overlay=true  )


cci_length = input.int(50, "cci length")
right_pivot = input.int(50, "right pivot")
left_pivot = input.int(50, "left pivot")
buffer = input.float(10.0, "buffer")
trend_matter = input.bool(true, "trend matter?")
showmid = input.bool ( false , "show mid?")
trend_type = input.string("cross","trend type" ,options = ["cross","slope"])
slowma_l = input.int(100, "slow ma length")
fastma_l = input.int(50, "fast ma length")
slope_l = input.int(5,  "slope's length for trend detection")
ksl = input.float(1.1)
ktp = input.float(2.2)
restf = input.timeframe(title="Time Frame of Last Period for Calculating max" , defval="D")


// Calculating Upper and Lower CCI
cci = ta.cci(hlc3,cci_length)

uppercci = 0.0
lowercci = 0.0

uppercci := fixnan(ta.pivothigh(cci, left_pivot, right_pivot)) - buffer
lowercci := fixnan(ta.pivotlow (cci, left_pivot, right_pivot)) + buffer
midccci  = math.avg(uppercci,lowercci)


// Support and Resistance based on CCI
res = uppercci*(0.015*ta.dev(hlc3,cci_length))+ ta.sma(hlc3,cci_length)
sup = lowercci*(0.015*ta.dev(hlc3,cci_length))+ ta.sma(hlc3,cci_length)
mid =  midccci*(0.015*ta.dev(hlc3,cci_length))+ ta.sma(hlc3,cci_length)


// Calculating trend
t_cross  = 0
t_cross := ta.ema(close,fastma_l) > ta.ema(close,slowma_l) ? 1 : ta.ema(close,fastma_l) < ta.ema(close,slowma_l) ? -1 : t_cross[1]

t_slope  = 0
t_slope := ta.ema(close,slowma_l) > ta.ema(close,slowma_l)[slope_l] ? 1 : ta.ema(close,slowma_l) < ta.ema(close,slowma_l)[slope_l]  ? -1 : t_slope[1]

t  = 0
t := trend_type == "cross" ? t_cross : trend_type == "slope" ? t_slope : na

colort =  trend_matter == false ? color.rgb(201, 251, 0) : t == 1 ? color.rgb(14, 243, 132) :  t == -1 ? color.rgb(255, 34, 34) : na
bull_t = trend_matter == false or t ==  1
bear_t = trend_matter == false or t == -1

plot(res, color = colort)
plot(sup, color = colort)
plot(showmid == true ? mid : na)


// Long and Short enter condition
buy  = bull_t == 1 and ta.lowest (2) < sup and close > open and close > sup
sell = bear_t == 1 and ta.highest(2) > res and close < open and close < res

plotshape( buy , color=color.rgb(6, 255, 23) , location = location.belowbar, style = shape.triangleup  , size = size.normal)
plotshape( sell, color=color.rgb(234, 4, 4) ,  location = location.abovebar, style = shape.triangledown, size = size.normal)


atr = ta.atr(100)


CLOSE=request.security(syminfo.tickerid, restf, close)
max = 0.0
max := CLOSE == CLOSE[1] ? math.max(max[1], atr) : atr
act_atr = 0.0
act_atr := CLOSE == CLOSE[1] ? act_atr[1] : max[1]

atr1 =  math.max(act_atr, atr)

dis_sl = atr1 * ksl
dis_tp = atr1 * ktp


var float longsl  = open[1] - dis_sl
var float shortsl = open[1] + dis_sl
var float longtp =   open[1] + dis_tp
var float shorttp =  open[1] - dis_tp


longCondition = buy
if (longCondition)
    strategy.entry("My Long Entry Id", strategy.long)

shortCondition = sell
if (shortCondition)
    strategy.entry("My Short Entry Id", strategy.short)


longsl  := strategy.position_size > 0  ? longsl[1]  : close - dis_sl
shortsl := strategy.position_size < 0 ? shortsl[1] : close + dis_sl
longtp  := strategy.position_size > 0  ? longtp[1]  : close + dis_tp
shorttp := strategy.position_size < 0 ? shorttp[1] : close - dis_tp


if strategy.position_size > 0
    strategy.exit(id="My Long close Id", from_entry ="My Long Entry Id" , stop=longsl, limit=longtp)
if strategy.position_size < 0
    strategy.exit(id="My Short close Id", from_entry ="My Short Entry Id" , stop=shortsl, limit=shorttp)