収縮バンドボリンジャーとRSIの組み合わせ戦略
概要
この戦略はブリン帯と比較的強い指標 ((RSI)) の組み合わせを使用して,ブリン帯の収縮期がRSI上昇と連携する機会を特定し,リスクを制御するためにトレンド追跡ストップを使用します.
戦略原則
この戦略の取引論理の核心は,ブリン帯の収縮を認識し,RSIが上昇しているときにトレンドが上昇の初期段階にあることを判断することです.具体的には,20日のブリン帯の中央軌道上の基準がATRより差であるとき*2時,我々はブリン帯の収縮を判定する;同時に,もし10日と14日のRSIが上昇傾向にあるならば,我々は,価格がブリン帯を突破して軌道に乗るのを予測し,多策を行う.
市場に入ると,ATRの安全距離+価格上昇によるストップを用い,利益をロックし,リスクをコントロールします. 価格がストップラインを超えたり,RSIが過熱したときに平仓します.
優位分析
この戦略の最大の利点は,ブリン帯の収縮を市場整理期を判断するために使用し,RSI指標の予測価格の突破方向と組み合わせることです.また,固定ストップではなく,適応性ストップを使用することで,市場の変動程度に応じて柔軟に調整することができ,リスクが制御可能であることを保証する前提でより大きな利益を得ることができます.
リスク分析
この戦略の主なリスクは,ブリン帯収縮とRSI上昇を認識する時に,市場が偽ブレークになる可能性があることにある.また,ストップの面で,波動が大きすぎると適応性ストップがタイムリーでストップできないかもしれない.ストップの方法を改善することによってこのリスクを軽減することができる (例えば曲線ストップ).
最適化の方向
この戦略は以下の点で最適化できます.
ブリン帯のパラメータ設定を改良し,収縮の判断を最適化
RSI周期のパラメータを試す
他の止損方法 (曲線止損,回顧止損など) の効果をテストする
異なる品種特性に合わせてパラメータを調整
要約する
この戦略は,ブリン帯とRSIの互換性を総合的に利用し,リスクを制御した前提でより良い引き戻し収益率を得ます.その後,停止方法,パラメータ選択などの面で最適化することができ,戦略を異なる取引品種により適したものにします.
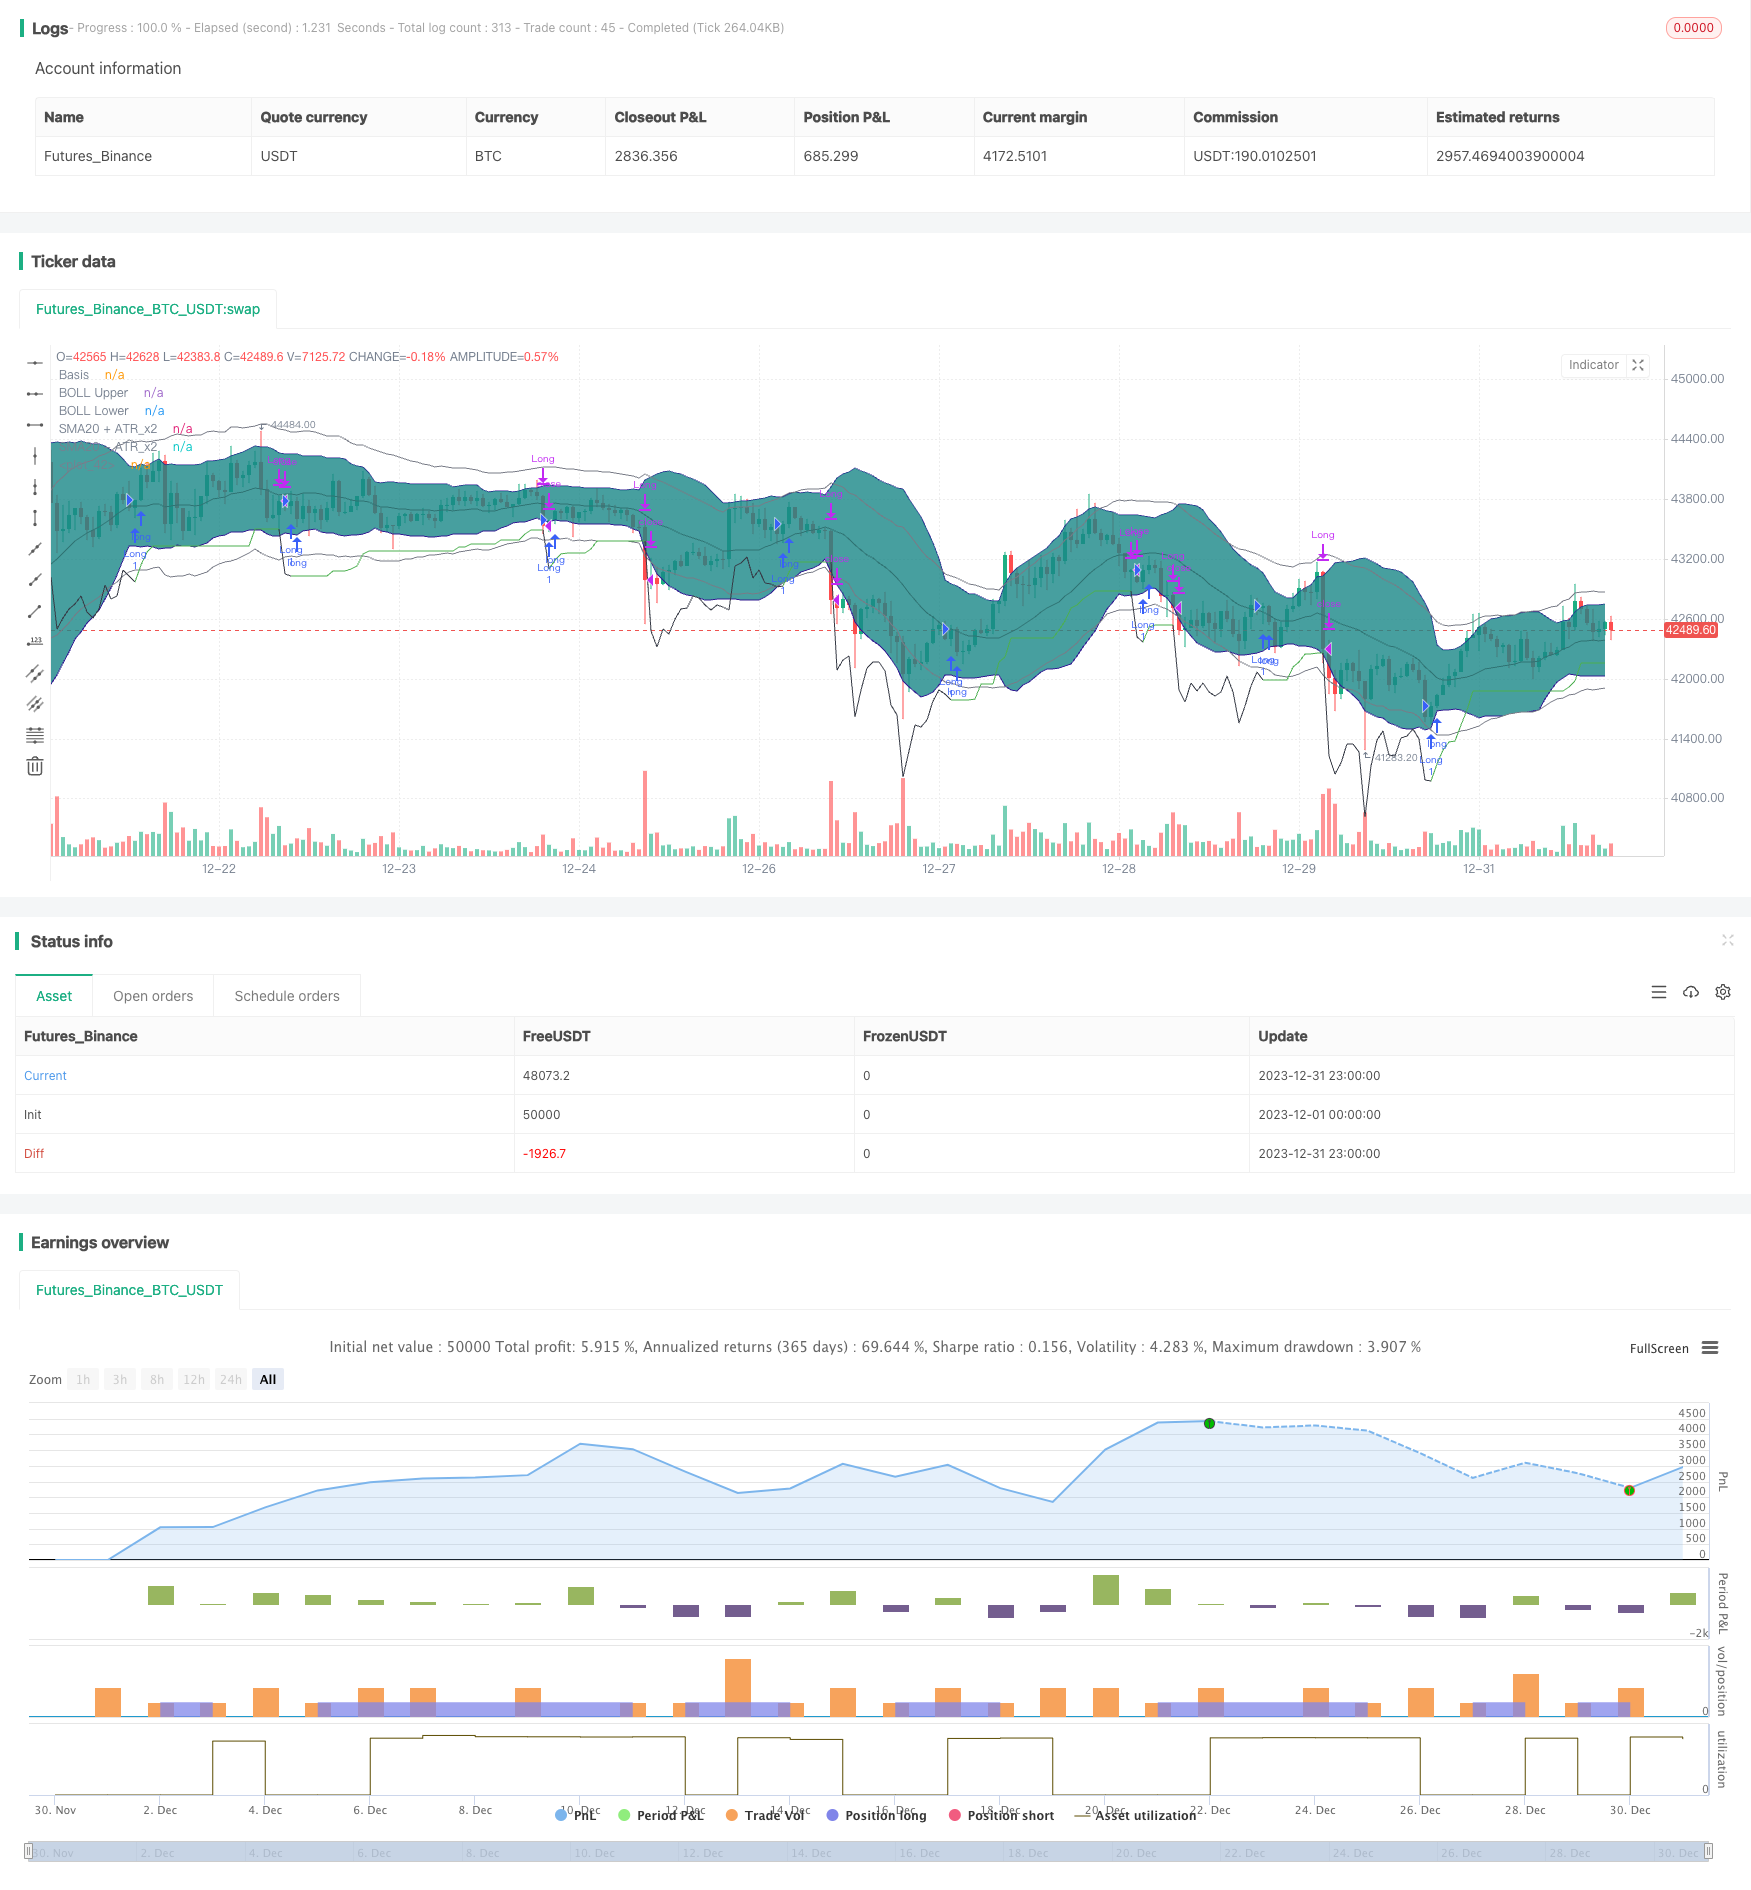
/*backtest
start: 2023-12-01 00:00:00
end: 2023-12-31 23:59:59
period: 1h
basePeriod: 15m
exchanges: [{"eid":"Futures_Binance","currency":"BTC_USDT"}]
*/

// This source code is subject to the terms of the Mozilla Public License 2.0 at https://mozilla.org/MPL/2.0/
// © DojiEmoji
//

//@version=4
strategy("[KL] BOLL + RSI Strategy",overlay=true,pyramiding=1)

// Timeframe {
backtest_timeframe_start = input(defval = timestamp("01 Apr 2016 13:30 +0000"), title = "Backtest Start Time", type = input.time)
USE_ENDTIME = input(false,title="Define backtest end-time (If false, will test up to most recent candle)")
backtest_timeframe_end = input(defval = timestamp("01 May 2021 19:30 +0000"), title = "Backtest End Time (if checked above)", type = input.time)
within_timeframe = true
// }

// Bollinger bands (sdv=2, len=20) {
BOLL_length = 20, BOLL_src = close, SMA20 = sma(BOLL_src, BOLL_length), BOLL_sDEV_x2 = 2 * stdev(BOLL_src, BOLL_length)
BOLL_upper = SMA20 + BOLL_sDEV_x2, BOLL_lower = SMA20 - BOLL_sDEV_x2
plot(SMA20, "Basis", color=#872323, offset = 0)
BOLL_p1 = plot(BOLL_upper, "BOLL Upper", color=color.navy, offset = 0, transp=50)
BOLL_p2 = plot(BOLL_lower, "BOLL Lower", color=color.navy, offset = 0, transp=50)
fill(BOLL_p1, BOLL_p2, title = "Background", color=#198787, transp=85)
// }

// Volatility Indicators {
ATR_x2 = atr(BOLL_length) * 2 // multiplier aligns with BOLL
avg_atr = sma(ATR_x2, input(1,title="No. of candles to lookback when determining ATR is decreasing"))
plot(SMA20+ATR_x2, "SMA20 + ATR_x2", color=color.gray, offset = 0, transp=50)
plot(SMA20-ATR_x2, "SMA20 - ATR_x2", color=color.gray, offset = 0, transp=50)
plotchar(ATR_x2, "ATR_x2", "", location = location.bottom)
//}

// Trailing stop loss {
TSL_source = low
var entry_price = float(0), var stop_loss_price = float(0)

trail_profit_line_color = color.green
if strategy.position_size == 0 or not within_timeframe
    trail_profit_line_color := color.black
    stop_loss_price := TSL_source - ATR_x2
else if strategy.position_size > 0
    stop_loss_price := max(stop_loss_price, TSL_source - ATR_x2)
plot(stop_loss_price, color=trail_profit_line_color)

if strategy.position_size > 0 and stop_loss_price > stop_loss_price[1]
	alert("Stop loss limit raised", alert.freq_once_per_bar)

// } end of Trailing stop loss

//Buy setup - Long positions {
is_squeezing = ATR_x2 > BOLL_sDEV_x2
if is_squeezing and within_timeframe and not is_squeezing[1]
	alert("BOLL bands are squeezing", alert.freq_once_per_bar)
else if not is_squeezing and within_timeframe and is_squeezing[1]
	alert("BOLL bands stopped squeezing", alert.freq_once_per_bar)

ema_trend = ema(close, 20)

concat(a, b) =>
	concat = a
	if a != ""
		concat := concat + ", "
	concat := concat + b
	concat
// }

// Sell setup - Long position {
rsi_10 = rsi(close, 10), rsi_14 = rsi(close, 14)
overbought = rsi_14 > input(70,title="[Exit] RSI(14) value considered as overbought") and rsi_10 > rsi_14
// } end of Sell setup - Long position

// MAIN: {
if within_timeframe
	entry_msg = ""
	exit_msg = ""

    // ENTRY {
	conf_count = 0
    volat_decr = avg_atr <= avg_atr[1]
	rsi_upslope = rsi_10 > rsi_10[1] and rsi_14 > rsi_14[1]

	if volat_decr and rsi_upslope and is_squeezing and strategy.position_size == 0
		strategy.entry("Long",strategy.long, comment=entry_msg)
		entry_price := close
		stop_loss_price := TSL_source - ATR_x2
	// }

    // EXIT	{
	if strategy.position_size > 0
		bExit = false
		if close <= entry_price and TSL_source <= stop_loss_price
            exit_msg := concat(exit_msg, "stop loss [TSL]")
			bExit := true
        else if close > entry_price and TSL_source <= stop_loss_price
            exit_msg := concat(exit_msg, "take profit [TSL]")
            bExit := true
		else if overbought
			exit_msg := concat(exit_msg, "overbought")
			bExit := true

        strategy.close("Long", when=bExit, comment=exit_msg)
	// }
// }

// CLEAN UP:
if strategy.position_size == 0 and not is_squeezing
	entry_price := 0
	stop_loss_price := float(0)