移動平均と組み合わせた効率的な定量取引戦略
概要
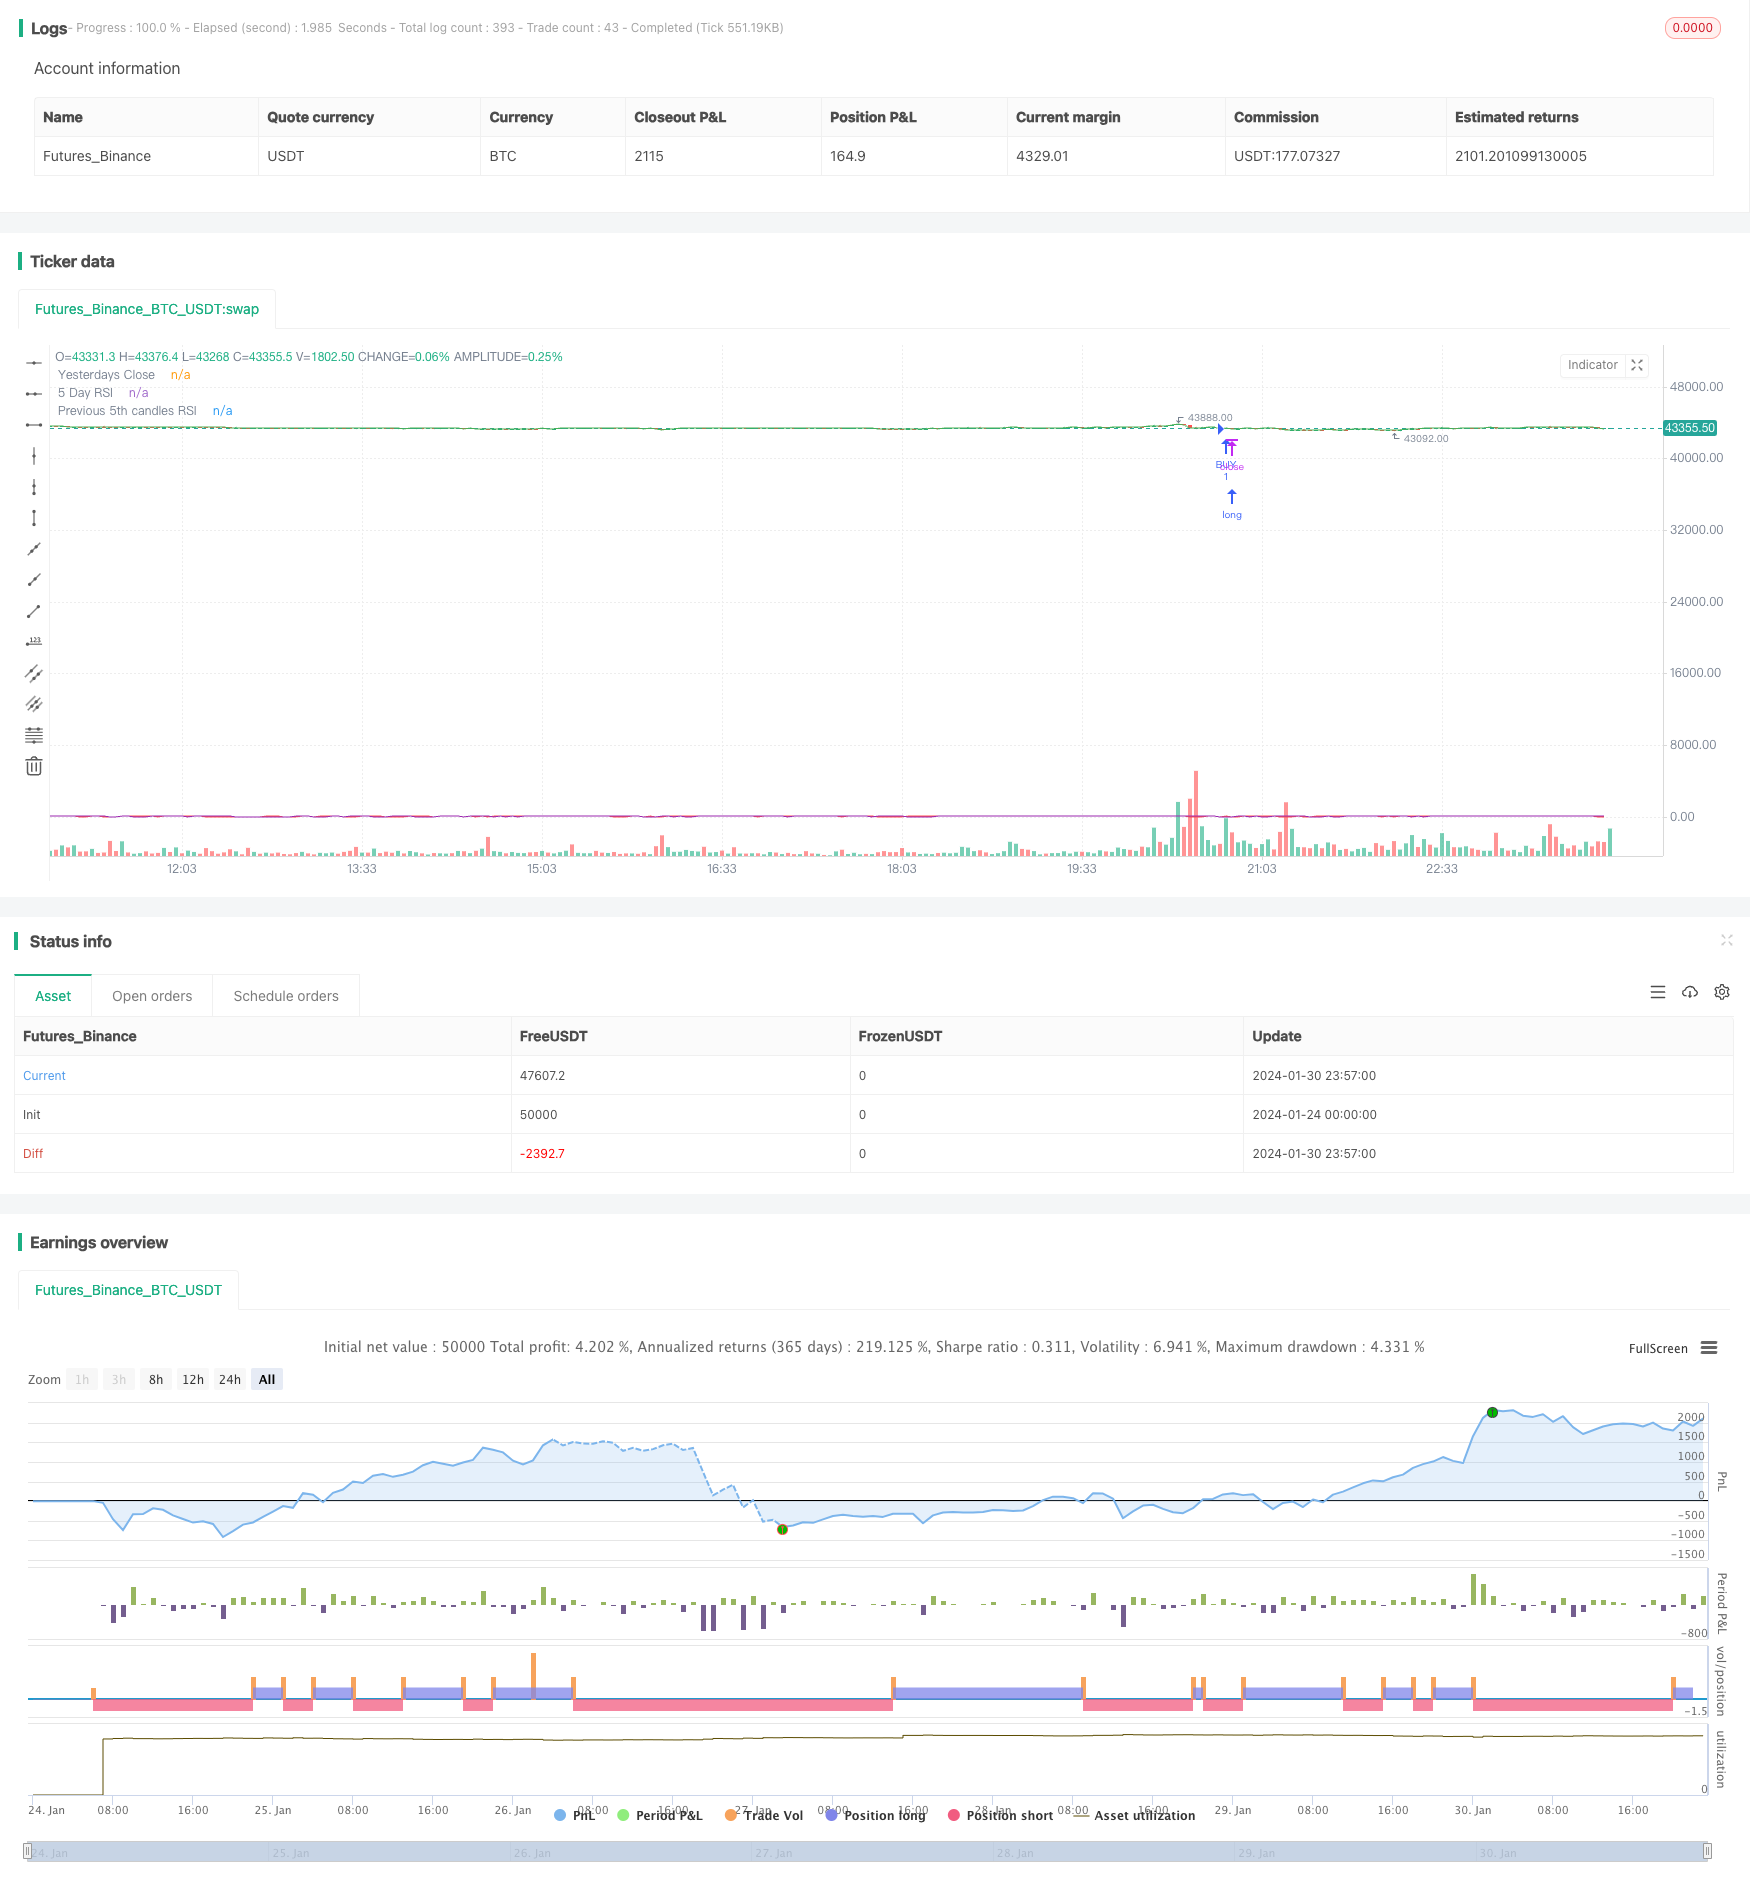
この戦略は,5日RSIと200日移動平均を組み合わせて取引決定シグナルを形成し,技術指標ポーチ戦略に属している.この戦略の主な取引原理は,価格が超買超売領域に運ばれるとき,シグナルが売り;価格が超売領域に落ちるとき,シグナルが買いである.この戦略の最大の利点は,戦略シグナルがより明確であり,取り戻しのリスクが低いことである.しかし,単一の技術指標ポーチを使用して取引決定を形成する制限も存在し,多要素モデルと機械学習アルゴリズムなどで最適化することができる.
戦略原則
この戦略は,主に5日間のRSIと200日間の移動平均を組み合わせて,価格の走行における超買超売り領域を判断し,取引決定を形成します.
5日RSI指数は,価格が走る超買超売領域を判断する. 超買線を72で設定し,超売領域を30で設定する. RSI指数が下から上へ30を突破すると買入シグナルが生成し,RSI指数が上から下へ72を突破すると売り出シグナルが生成する.
200日移動平均は,価格の中間長線の傾向方向を判断する.価格が200日平均線を下回るときは,価格下行期;価格が200日平均線上回るときは,価格上行期である.
1と2の判断を組み合わせて,この戦略は,ault時に5日RSI指標がオーバーバイして72を下回ると売る,そして5日RSIが30を下回って200日平均線を下回ると買う.
戦略的優位性
戦略信号はより明確で,RSI指数Judgment領域を使用して,OverboughtとOverSoldの信号を判断する.
200日平均線は大きなトレンドの方向を判断し,逆行操作を避ける.
リスク管理のために,最大保有額を設定できます.
戦略パラメータの最適化スペースは広く,RSIパラメータと平均線パラメータを調整できます.
撤回リスクは低く,有効な制御戦略は最大撤回である.
戦略リスク
RSI指数と平均線指数のみを使用すると,戦略信号は不安定になり,多頭空頭振動市場の買い物損失のリスクがあります.
RSIパラメータと平均線パラメータを最適化してテストし,よりよい戦略効果を得る.
他の指標やモデル判断を導入し,戦略信号を最適化することができる.例えば,波動率指標,機械学習判断などを導入する.
戦略最適化の方向性
MACD,KD,波動率指数など.
機械学習モデルの判断を追加する.例えば,LSTMは取引信号の安定性を判断する.
量的な要因を追加する.取引量の変化,資金流動などの判断資金面要因.
RSIパラメータ,平均線パラメータなど.
移動止損,時間止損など.
要約する
本戦略は,主に5日RSI指標と200日平均線指標の組み合わせを使用して,価格の超買い超売り領域を判断し,取引シグナルを形成し,技術指標の組み合わせ戦略に属します.戦略信号は,比較的明確で,最大撤退リスクは小さい.しかし,多指標の組み合わせと機械学習判断などにより,戦略の効果を高めるためにさらに最適化することができます.
/*backtest
start: 2024-01-24 00:00:00
end: 2024-01-31 00:00:00
period: 3m
basePeriod: 1m
exchanges: [{"eid":"Futures_Binance","currency":"BTC_USDT"}]
*/

// This source code is subject to the terms of the Mozilla Public License 2.0 at https://mozilla.org/MPL/2.0/
// ©chewyScripts.

//@version=5
strategy("96er RSI+200EMA Strategy + Alerts", overlay=true)
// This works best on a small account $100, with 50% of equity and up to 10 max open trades.
// 96% Profitable, turns $100 into $350 in 1 month. very few losses. super happy with it.
// So far it triples the account on a 1m chart in 1 month back testing on the SEI-USD pair.
// I did not test on FX pairs or other instruments.
// had some issues with the inputs not working so had to hard code some, also the lastClose var sometimes breaks and starts following every candle, not sure why.

in_r1 = input.int(5,"5 day input or RSI1")
in_openOrders = input.int(3,"max open orders")

in_lowerRSI = input.int(30,"RSI Lower")
in_upperRSI = input.int(72,"RSI Upper ")

in_emaperiod = input.int(200,"EMA Period")

in_buybreakout = input.int(50,"Buy breakout range")

in_buyTP = input.float(1.05,"Buy TP: 1+TP %, .05 seems to work well.")
in_sellTP = input.float(0.9850, "Sell TP: 1-TP%. .025 seems to work well. ")

simple int rsi5 = in_r1

// 3 rsi strategy , when all of them are overbought we sell, and vice versa
rsi7 = ta.rsi(close,rsi5)
lastClose = request.security(syminfo.tickerid, "D", close, lookahead = barmerge.lookahead_on)
rsi3 = ta.rsi(close[5],rsi5)

ma = ta.ema(close,in_emaperiod)

plot(rsi7,"5 Day RSI",color.red)
plot(lastClose,"Yesterdays Close",color.green)
plot(rsi3,"Previous 5th candles RSI",color.purple)


// sell condition
//sell = ta.crossunder(rsi7,70) and ta.crossunder(rsi14,70) and ta.crossunder(rsi21,70)

//buy condition
//buy = ta.crossover(rsi7,in_lowerRSI) and close < ma and rsi3 <= in_upperRSI and strategy.opentrades < in_openOrders
//sell = ta.crossunder(rsi7,in_upperRSI) and close > ma and rsi3 >= in_lowerRSI3 and strategy.opentrades < in_openOrders

buy = ta.crossover(rsi7,in_lowerRSI) and close < ma and close < lastClose and strategy.opentrades < in_openOrders
sell = ta.crossunder(rsi7,in_upperRSI) and close > ma and close > lastClose and strategy.opentrades < in_openOrders


var lastBuy = close
var lastSell = close

if (buy)
    strategy.entry("BUY", strategy.long)
    lastBuy := close
    alert("Buy")

if ((close >= lastBuy*in_buyTP ) or rsi7 > in_buybreakout and close >= lastClose and (close >= lastClose*in_buyTP or close >= lastBuy*in_buyTP ) )
    strategy.close("BUY", "BUY Exit")
    alert("Buy Exit")

if (sell)
    strategy.entry("SELL", strategy.short)
    lastSell := close
    alert("Sell")

if ( close < ma and (close <= lastSell*in_sellTP ) or (close < lastClose*in_sellTP) )
    strategy.close("SELL", "Sell Exit")
    alert("Sell Exit")