定量的取引モメンタム方向収束戦略
作成日:
2024-02-02 10:51:11
最終変更日:
2024-02-02 10:51:11
コピー:
1
クリック数:
725
1
フォロー
1750
フォロワー
概要
この戦略の名前は,量化取引動力の方向収束戦略であり,ウィリアム・ブラウが彼の著書『モメンタム,ディレクション,そしてディバーゲンス』で記述した技術指標に基づいて設計された量化取引戦略である.この戦略は,動力,方向,そして収束の3つの重要な次元に焦点を当て,株式価格の動力の指標を計算して,市場の傾向の方向を判断し,価格と指標の間の離散現象を探して取引機会を得ます.
戦略原則
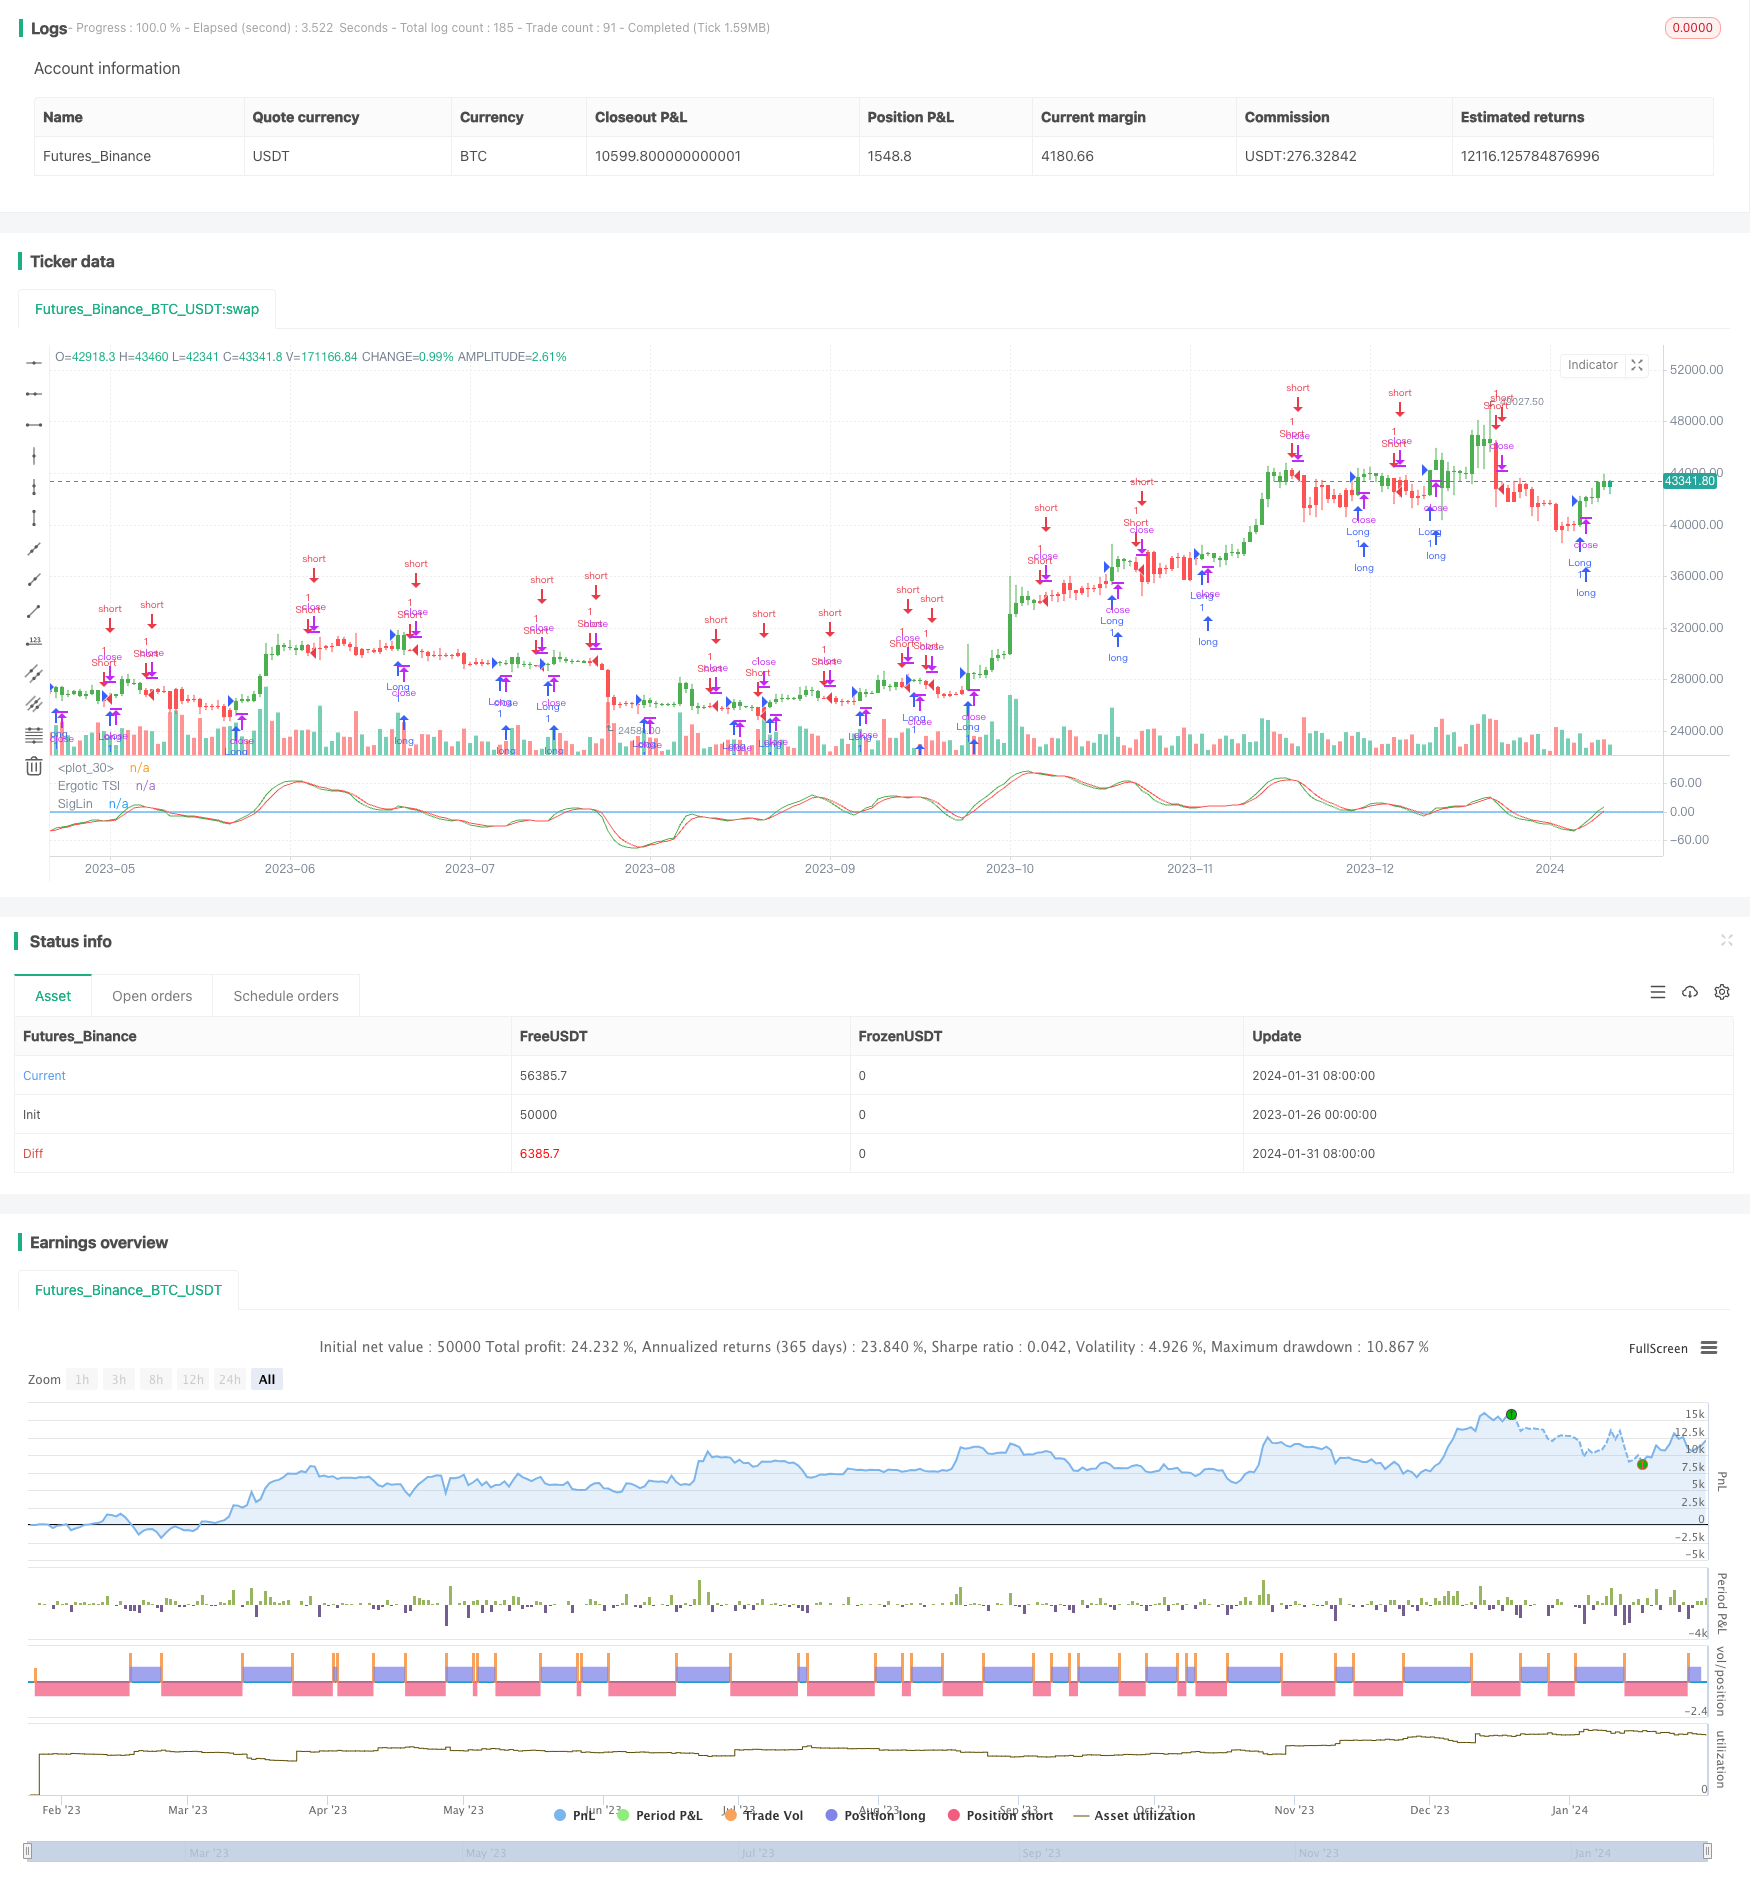
この戦略の核心指標は,緊急動量指数 (ERGOTIC TSI) で,計算式は以下の通りである.
Val1 = 100 * EMA(EMA(EMA(价格变化量,r),s),u)

Val2 = EMA(EMA(EMA(价格变化量的绝对值,r),s),u)

Ergotic TSI = 如果Val2不等于0,则为Val1/Val2,否则为0
その中で,r,s,uは平滑参数である。この指標は,価格変化量に対する価格変化量絶対値の割合を反映し,動量振動指標に属している。それから,ERGOTIC TSIのEMA平滑移動平均を信号線として計算する。TSI上を通るときは多し,下を通るときは空にする。
優位分析
この戦略の利点は以下の通りです
- 価格の変化を把握する能力
- 価格の変動をフィルタリングする
- 優れた脱離特性を有する
- パラメータの設定は柔軟で,滑らかさを調整できます.
リスク分析
この戦略にはいくつかのリスクがあります.
- 逆転の時に誤った信号が出る
- パラメータを正しく設定しない場合,取引の機会を逃したり,偽の信号を追加したりします.
- 異なる品種と取引環境に適したパラメータの調整が必要
リスクは,最適化パラメータ,他の指標の組み合わせによって確認され,ストップ・ロスを設定して制御できます.
最適化の方向
この戦略は以下の点で最適化できます.
- 異なる価格入力 (開値,閉値,中間値など) をテストします.
- r,s,uの平滑参数値を調整して,最適な参数組み合わせを探します.
- 他の指標またはフィルタリング条件を追加し,信号をさらに確認します.
- ストップポイントと退出メカニズムを設定する
要約する
この戦略は,動力の変化,トレンド判断,特性の逸脱を総合的に考慮し,トレンドの機会を効果的に捕捉することができる.パラメータ最適化,信号フィルタリング,リスク制御の手段によって,優れた戦略パフォーマンスを得ることができる.全体的に,この戦略は合理的に設計されており,さらなる研究と実践に値する.
ストラテジーソースコード
/*backtest
start: 2023-01-26 00:00:00
end: 2024-02-01 00:00:00
period: 1d
basePeriod: 1h
exchanges: [{"eid":"Futures_Binance","currency":"BTC_USDT"}]
*/

//@version = 2
////////////////////////////////////////////////////////////
//  Copyright by HPotter v1.0 13/12/2016
// r - Length of first EMA smoothing of 1 day momentum        4
// s - Length of second EMA smoothing of 1 day smoothing      8
// u- Length of third EMA smoothing of 1 day momentum         6
// Length of EMA signal line                                  3
// Source of Ergotic TSI                                      Close
//
// This is one of the techniques described by William Blau in his book "Momentum,
// Direction and Divergence" (1995). If you like to learn more, we advise you to
// read this book. His book focuses on three key aspects of trading: momentum,
// direction and divergence. Blau, who was an electrical engineer before becoming
// a trader, thoroughly examines the relationship between price and momentum in
// step-by-step examples. From this grounding, he then looks at the deficiencies
// in other oscillators and introduces some innovative techniques, including a
// fresh twist on Stochastics. On directional issues, he analyzes the intricacies
// of ADX and offers a unique approach to help define trending and non-trending periods.
//
// You can use in the xPrice any series: Open, High, Low, Close, HL2, HLC3, OHLC4 and ect...
// You can change long to short in the Input Settings
// Please, use it only for learning or paper trading. Do not for real trading.
////////////////////////////////////////////////////////////
strategy(title="Ergotic TSI Strategy Backtest")
r = input(4, minval=1)
s = input(8, minval=1)
u = input(6, minval=1)
SmthLen = input(3, minval=1)
reverse = input(false, title="Trade reverse")
hline(0, color=blue, linestyle=line)
xPrice = close
xPrice1 = xPrice - xPrice[1]
xPrice2 = abs(xPrice - xPrice[1])
xSMA_R = ema(ema(ema(xPrice1,r), s),u)
xSMA_aR = ema(ema(ema(xPrice2, r), s),u)
Val1 = 100 * xSMA_R
Val2 = xSMA_aR
xTSI = iff (Val2 != 0, Val1 / Val2, 0)
xEMA_TSI = ema(xTSI, SmthLen)
pos = iff(xTSI > xEMA_TSI, 1,
	   iff(xTSI < xEMA_TSI, -1, nz(pos[1], 0)))
possig = iff(reverse and pos == 1, -1,
          iff(reverse and pos == -1, 1, pos))
if (possig == 1)
    strategy.entry("Long", strategy.long)
if (possig == -1)
    strategy.entry("Short", strategy.short)
barcolor(possig == -1 ? red: possig == 1 ? green : blue )
plot(xTSI, color=green, title="Ergotic TSI")
plot(xEMA_TSI, color=red, title="SigLin")